|
Download Data (XLS File) |
|
||||||||
|
||||||||
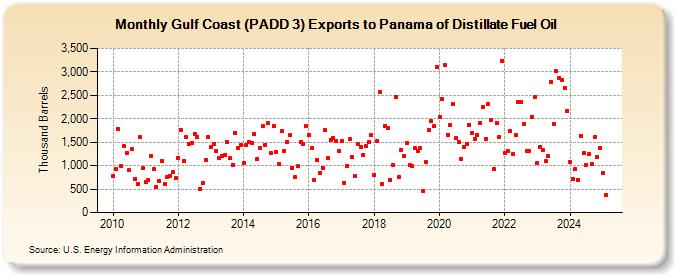
| Gulf Coast (PADD 3) Exports to Panama of Distillate Fuel Oil (Thousand Barrels) | ||||||||
| Year | Jan | Feb | Mar | Apr | May | Jun | Jul | Aug | Sep | Oct | Nov | Dec |
|---|---|---|---|---|---|---|---|---|---|---|---|---|
| 2010 | 783 | 926 | 1,779 | 996 | 1,421 | 1,278 | 897 | 1,346 | 723 | 614 | 1,611 | 940 |
| 2011 | 659 | 689 | 1,211 | 923 | 542 | 683 | 1,100 | 609 | 748 | 789 | 858 | 735 |
| 2012 | 1,171 | 1,768 | 1,108 | 1,610 | 1,465 | 1,490 | 1,671 | 1,620 | 510 | 628 | 1,114 | 1,612 |
| 2013 | 1,397 | 1,458 | 1,307 | 1,170 | 1,210 | 1,232 | 1,497 | 1,165 | 1,024 | 1,706 | 1,381 | 1,441 |
| 2014 | 1,056 | 1,442 | 1,504 | 1,487 | 1,682 | 1,148 | 1,384 | 1,841 | 1,448 | 1,905 | 1,263 | 1,849 |
| 2015 | 1,299 | 1,037 | 1,743 | 1,315 | 1,511 | 1,649 | 954 | 749 | 987 | 1,514 | 1,465 | 1,846 |
| 2016 | 1,654 | 1,366 | 688 | 1,120 | 854 | 956 | 1,754 | 1,160 | 1,554 | 1,591 | 1,529 | 1,320 |
| 2017 | 1,524 | 633 | 998 | 1,563 | 1,191 | 778 | 1,458 | 1,406 | 1,236 | 1,414 | 1,510 | 1,645 |
| 2018 | 799 | 1,520 | 2,561 | 609 | 1,854 | 1,810 | 692 | 1,010 | 2,468 | 767 | 1,338 | 1,213 |
| 2019 | 1,492 | 1,013 | 997 | 1,368 | 1,317 | 1,371 | 468 | 1,082 | 1,752 | 1,944 | 1,835 | 3,105 |
| 2020 | 2,042 | 2,423 | 3,148 | 1,659 | 1,858 | 2,307 | 1,595 | 1,503 | 1,146 | 1,394 | 1,472 | 1,877 |
| 2021 | 1,689 | 1,565 | 1,662 | 1,901 | 2,249 | 1,577 | 2,319 | 1,964 | 932 | 1,918 | 1,602 | 3,241 |
| 2022 | 1,279 | 1,322 | 1,735 | 1,254 | 1,659 | 2,347 | 2,355 | 1,894 | 1,318 | 1,313 | 2,038 | 2,466 |
| 2023 | 1,079 | 1,280 | 1,556 | 1,092 | 1,114 | 3,319 | 1,634 | 3,012 | 3,173 | 2,548 | 2,661 | 2,164 |
| 2024 | 1,079 | |||||||||||
| - = No Data Reported; -- = Not Applicable; NA = Not Available; W = Withheld to avoid disclosure of individual company data. |
| Release Date: 3/29/2024 |
| Next Release Date: 4/30/2024 |