|
Download Data (XLS File) |
|
||||||||
|
||||||||
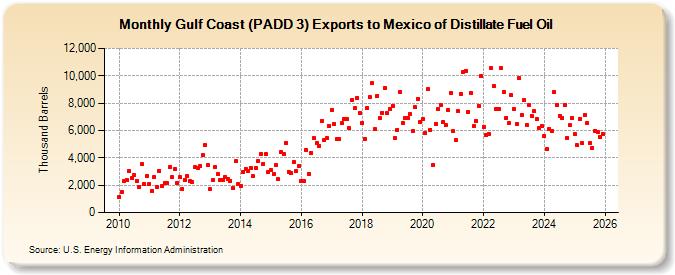
| Gulf Coast (PADD 3) Exports to Mexico of Distillate Fuel Oil (Thousand Barrels) | ||||||||
| Year | Jan | Feb | Mar | Apr | May | Jun | Jul | Aug | Sep | Oct | Nov | Dec |
|---|---|---|---|---|---|---|---|---|---|---|---|---|
| 2010 | 1,159 | 1,503 | 2,310 | 2,413 | 3,031 | 2,505 | 2,718 | 2,339 | 1,858 | 3,528 | 2,060 | 2,706 |
| 2011 | 2,097 | 1,602 | 2,577 | 1,870 | 3,046 | 1,944 | 2,174 | 2,152 | 3,313 | 2,584 | 3,211 | 2,194 |
| 2012 | 2,589 | 1,726 | 2,413 | 2,637 | 2,295 | 2,224 | 3,305 | 3,259 | 3,390 | 4,181 | 4,917 | 3,445 |
| 2013 | 1,686 | 2,388 | 3,340 | 2,828 | 2,390 | 2,367 | 2,616 | 2,465 | 2,315 | 1,793 | 3,733 | 2,078 |
| 2014 | 1,937 | 2,957 | 3,202 | 3,027 | 3,273 | 2,650 | 3,257 | 3,783 | 4,282 | 3,558 | 4,274 | 2,983 |
| 2015 | 3,090 | 2,811 | 3,457 | 2,426 | 4,416 | 4,281 | 5,095 | 2,991 | 2,859 | 3,732 | 3,030 | 3,371 |
| 2016 | 2,285 | 2,338 | 4,575 | 2,815 | 4,356 | 5,468 | 5,076 | 4,872 | 6,724 | 5,282 | 5,419 | 6,337 |
| 2017 | 7,508 | 6,457 | 5,365 | 5,371 | 6,515 | 6,874 | 6,836 | 6,146 | 8,216 | 7,617 | 8,374 | 7,273 |
| 2018 | 6,551 | 5,412 | 7,637 | 8,422 | 9,440 | 6,077 | 8,533 | 6,918 | 7,310 | 9,120 | 7,277 | 7,578 |
| 2019 | 7,796 | 5,445 | 6,037 | 8,806 | 6,570 | 6,931 | 6,929 | 7,202 | 5,978 | 7,694 | 8,327 | 6,627 |
| 2020 | 6,848 | 5,780 | 9,003 | 6,068 | 3,441 | 6,493 | 7,564 | 7,877 | 6,619 | 6,381 | 7,483 | 8,745 |
| 2021 | 5,935 | 5,299 | 7,398 | 8,680 | 10,268 | 10,365 | 7,385 | 8,720 | 6,320 | 6,724 | 7,807 | 9,970 |
| 2022 | 6,275 | 5,655 | 5,754 | 10,548 | 9,249 | 7,545 | 7,594 | 10,545 | 8,843 | 6,937 | 6,562 | 8,592 |
| 2023 | 7,779 | 6,581 | 10,329 | 7,302 | 8,118 | 6,354 | 8,321 | 6,556 | 7,480 | 6,793 | 5,990 | 6,325 |
| 2024 | 5,601 | 4,660 | 6,271 | 5,973 | ||||||||
| - = No Data Reported; -- = Not Applicable; NA = Not Available; W = Withheld to avoid disclosure of individual company data. |
| Release Date: 6/28/2024 |
| Next Release Date: 7/31/2024 |