|
Download Data (XLS File) |
|
|||||
|
|||||
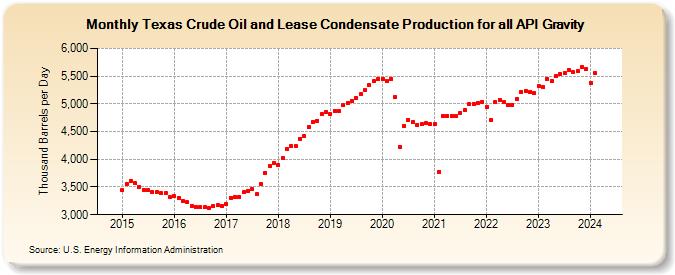
| Texas Crude Oil and Lease Condensate Production for all API Gravity (Thousand Barrels per Day) | |||||
| Year | Jan | Feb | Mar | Apr | May | Jun | Jul | Aug | Sep | Oct | Nov | Dec |
|---|---|---|---|---|---|---|---|---|---|---|---|---|
| 2015 | 3,441 | 3,555 | 3,617 | 3,568 | 3,508 | 3,454 | 3,442 | 3,407 | 3,407 | 3,389 | 3,386 | 3,319 |
| 2016 | 3,339 | 3,301 | 3,256 | 3,221 | 3,165 | 3,143 | 3,139 | 3,139 | 3,125 | 3,159 | 3,168 | 3,166 |
| 2017 | 3,196 | 3,308 | 3,317 | 3,323 | 3,403 | 3,436 | 3,462 | 3,366 | 3,549 | 3,760 | 3,886 | 3,930 |
| 2018 | 3,897 | 4,024 | 4,185 | 4,235 | 4,242 | 4,374 | 4,413 | 4,575 | 4,674 | 4,695 | 4,809 | 4,861 |
| 2019 | 4,808 | 4,878 | 4,868 | 4,972 | 5,008 | 5,047 | 5,107 | 5,169 | 5,243 | 5,332 | 5,403 | 5,444 |
| 2020 | 5,450 | 5,404 | 5,449 | 5,122 | 4,225 | 4,598 | 4,713 | 4,664 | 4,626 | 4,631 | 4,647 | 4,628 |
| 2021 | 4,629 | 3,775 | 4,779 | 4,780 | 4,780 | 4,777 | 4,839 | 4,890 | 4,988 | 4,995 | 5,021 | 5,030 |
| 2022 | 4,946 | 4,704 | 5,030 | 5,076 | 5,029 | 4,975 | 4,979 | 5,092 | 5,211 | 5,233 | 5,220 | 5,195 |
| 2023 | 5,318 | 5,306 | 5,454 | 5,408 | 5,500 | 5,538 | 5,560 | 5,603 | 5,570 | 5,586 | 5,658 | 5,649 |
| 2024 | 5,361 | |||||||||||
| - = No Data Reported; -- = Not Applicable; NA = Not Available; W = Withheld to avoid disclosure of individual company data. |
| Release Date: 3/29/2024 |
| Next Release Date: 4/30/2024 |
Referring Pages: