|
Download Data (XLS File) |
|
|||||
|
|||||
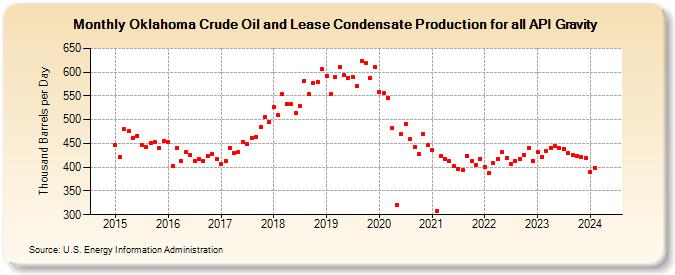
| Oklahoma Crude Oil and Lease Condensate Production for all API Gravity (Thousand Barrels per Day) | |||||
| Year | Jan | Feb | Mar | Apr | May | Jun | Jul | Aug | Sep | Oct | Nov | Dec |
|---|---|---|---|---|---|---|---|---|---|---|---|---|
| 2015 | 447 | 421 | 480 | 476 | 462 | 466 | 446 | 443 | 450 | 453 | 440 | 456 |
| 2016 | 454 | 403 | 441 | 414 | 431 | 425 | 414 | 418 | 413 | 424 | 428 | 417 |
| 2017 | 407 | 413 | 441 | 430 | 432 | 454 | 448 | 462 | 464 | 485 | 505 | 496 |
| 2018 | 526 | 509 | 554 | 533 | 532 | 513 | 529 | 582 | 553 | 577 | 579 | 607 |
| 2019 | 592 | 554 | 589 | 611 | 594 | 588 | 589 | 570 | 624 | 619 | 588 | 611 |
| 2020 | 558 | 557 | 546 | 482 | 321 | 469 | 491 | 460 | 443 | 427 | 470 | 446 |
| 2021 | 437 | 307 | 424 | 418 | 414 | 403 | 396 | 394 | 424 | 412 | 404 | 418 |
| 2022 | 400 | 387 | 408 | 417 | 433 | 419 | 407 | 414 | 417 | 425 | 441 | 414 |
| 2023 | 432 | 422 | 434 | 440 | 444 | 440 | 439 | 429 | 426 | 424 | 421 | 419 |
| 2024 | 389 | |||||||||||
| - = No Data Reported; -- = Not Applicable; NA = Not Available; W = Withheld to avoid disclosure of individual company data. |
| Release Date: 3/29/2024 |
| Next Release Date: 4/30/2024 |
Referring Pages: