|
Download Data (XLS File) |
|
|||||
|
|||||
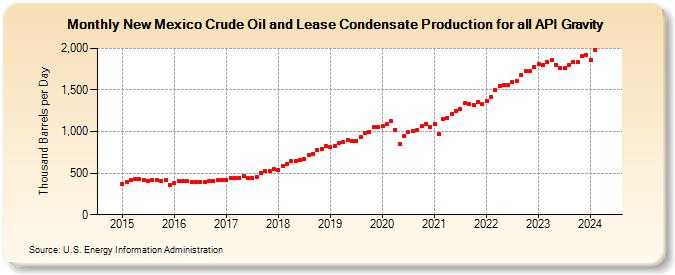
| New Mexico Crude Oil and Lease Condensate Production for all API Gravity (Thousand Barrels per Day) | |||||
| Year | Jan | Feb | Mar | Apr | May | Jun | Jul | Aug | Sep | Oct | Nov | Dec |
|---|---|---|---|---|---|---|---|---|---|---|---|---|
| 2015 | 368 | 394 | 419 | 427 | 427 | 416 | 406 | 416 | 416 | 408 | 414 | 359 |
| 2016 | 379 | 407 | 406 | 405 | 393 | 389 | 392 | 392 | 401 | 408 | 416 | 420 |
| 2017 | 419 | 443 | 442 | 445 | 462 | 443 | 447 | 459 | 500 | 523 | 528 | 555 |
| 2018 | 541 | 584 | 615 | 644 | 645 | 655 | 666 | 713 | 735 | 775 | 795 | 822 |
| 2019 | 810 | 828 | 862 | 871 | 895 | 885 | 889 | 935 | 986 | 994 | 1,049 | 1,056 |
| 2020 | 1,066 | 1,087 | 1,125 | 1,023 | 847 | 945 | 991 | 1,005 | 1,017 | 1,070 | 1,094 | 1,056 |
| 2021 | 1,092 | 991 | 1,166 | 1,182 | 1,234 | 1,274 | 1,300 | 1,376 | 1,362 | 1,395 | 1,439 | 1,394 |
| 2022 | 1,380 | 1,439 | 1,513 | 1,559 | 1,575 | 1,575 | 1,619 | 1,654 | 1,726 | 1,749 | 1,743 | 1,788 |
| 2023 | 1,838 | 1,805 | 1,841 | 1,851 | 1,799 | 1,735 | 1,748 | 1,799 | 1,811 | 1,804 | 1,894 | 1,953 |
| 2024 | 1,862 | 1,983 | ||||||||||
| - = No Data Reported; -- = Not Applicable; NA = Not Available; W = Withheld to avoid disclosure of individual company data. |
| Release Date: 8/30/2024 |
| Next Release Date: 9/30/2024 |
Referring Pages: