|
Download Data (XLS File) |
|
|||||
|
|||||
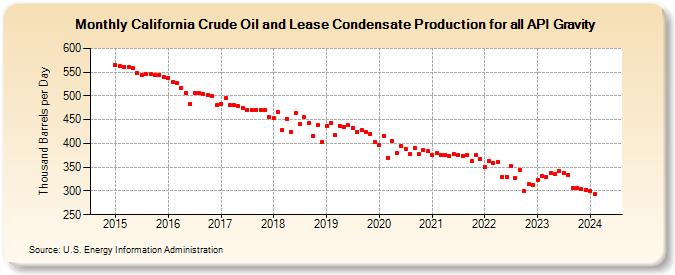
| California Crude Oil and Lease Condensate Production for all API Gravity (Thousand Barrels per Day) | |||||
| Year | Jan | Feb | Mar | Apr | May | Jun | Jul | Aug | Sep | Oct | Nov | Dec |
|---|---|---|---|---|---|---|---|---|---|---|---|---|
| 2015 | 564 | 562 | 561 | 560 | 559 | 549 | 544 | 547 | 546 | 543 | 545 | 539 |
| 2016 | 538 | 530 | 527 | 517 | 507 | 484 | 506 | 507 | 505 | 501 | 499 | 480 |
| 2017 | 484 | 495 | 480 | 480 | 478 | 475 | 471 | 470 | 471 | 471 | 470 | 456 |
| 2018 | 454 | 466 | 428 | 452 | 425 | 464 | 440 | 455 | 443 | 416 | 438 | 403 |
| 2019 | 437 | 444 | 418 | 437 | 435 | 438 | 432 | 425 | 428 | 425 | 420 | 403 |
| 2020 | 396 | 416 | 370 | 405 | 379 | 394 | 389 | 378 | 391 | 377 | 387 | 384 |
| 2021 | 375 | 379 | 375 | 376 | 373 | 377 | 376 | 374 | 376 | 363 | 376 | 368 |
| 2022 | 350 | 364 | 359 | 361 | 329 | 330 | 352 | 328 | 345 | 332 | 328 | 325 |
| 2023 | 312 | 303 | 305 | 310 | 310 | 311 | 308 | 306 | 307 | 306 | 305 | 302 |
| 2024 | 299 | |||||||||||
| - = No Data Reported; -- = Not Applicable; NA = Not Available; W = Withheld to avoid disclosure of individual company data. |
| Release Date: 3/29/2024 |
| Next Release Date: 4/30/2024 |
Referring Pages: