|
Download Data (XLS File) |
|
|||||
|
|||||
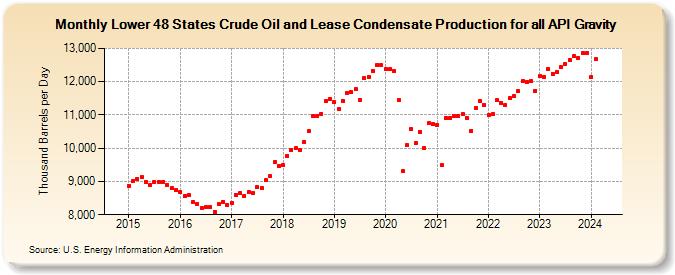
| Lower 48 States Crude Oil and Lease Condensate Production for all API Gravity (Thousand Barrels per Day) | |||||
| Year | Jan | Feb | Mar | Apr | May | Jun | Jul | Aug | Sep | Oct | Nov | Dec |
|---|---|---|---|---|---|---|---|---|---|---|---|---|
| 2015 | 8,882 | 9,002 | 9,077 | 9,148 | 9,001 | 8,910 | 8,995 | 9,001 | 9,005 | 8,902 | 8,809 | 8,752 |
| 2016 | 8,685 | 8,553 | 8,589 | 8,384 | 8,329 | 8,205 | 8,223 | 8,229 | 8,090 | 8,307 | 8,388 | 8,294 |
| 2017 | 8,356 | 8,578 | 8,638 | 8,576 | 8,678 | 8,649 | 8,824 | 8,799 | 9,034 | 9,161 | 9,575 | 9,470 |
| 2018 | 9,493 | 9,749 | 9,954 | 10,002 | 9,939 | 10,189 | 10,502 | 10,964 | 10,971 | 11,021 | 11,388 | 11,448 |
| 2019 | 11,375 | 11,164 | 11,430 | 11,669 | 11,679 | 11,761 | 11,448 | 12,097 | 12,135 | 12,330 | 12,516 | 12,499 |
| 2020 | 12,368 | 12,368 | 12,326 | 11,448 | 9,310 | 10,085 | 10,560 | 10,135 | 10,484 | 9,996 | 10,732 | 10,709 |
| 2021 | 10,679 | 9,459 | 10,898 | 10,872 | 10,946 | 10,926 | 11,012 | 10,868 | 10,492 | 11,127 | 11,336 | 11,227 |
| 2022 | 11,030 | 10,808 | 11,366 | 11,328 | 11,287 | 11,382 | 11,403 | 11,572 | 11,895 | 11,943 | 11,931 | 11,691 |
| 2023 | 12,120 | 12,086 | 12,335 | 12,216 | 12,264 | 12,471 | 12,528 | 12,645 | 12,831 | 12,793 | 12,867 | 12,862 |
| 2024 | 12,107 | |||||||||||
| - = No Data Reported; -- = Not Applicable; NA = Not Available; W = Withheld to avoid disclosure of individual company data. |
| Release Date: 3/29/2024 |
| Next Release Date: 4/30/2024 |
Referring Pages: