|
Download Data (XLS File) |
|
|||||
|
|||||
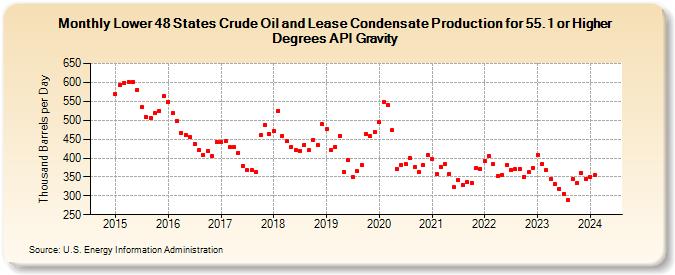
| Lower 48 States Crude Oil and Lease Condensate Production for 55.1 or Higher Degrees API Gravity (Thousand Barrels per Day) | |||||
| Year | Jan | Feb | Mar | Apr | May | Jun | Jul | Aug | Sep | Oct | Nov | Dec |
|---|---|---|---|---|---|---|---|---|---|---|---|---|
| 2015 | 569 | 594 | 599 | 601 | 602 | 581 | 534 | 508 | 506 | 518 | 525 | 563 |
| 2016 | 549 | 518 | 499 | 467 | 460 | 455 | 437 | 421 | 409 | 419 | 404 | 442 |
| 2017 | 443 | 444 | 429 | 428 | 414 | 379 | 367 | 368 | 362 | 460 | 488 | 463 |
| 2018 | 471 | 525 | 459 | 444 | 430 | 421 | 419 | 435 | 420 | 448 | 435 | 489 |
| 2019 | 476 | 420 | 430 | 459 | 363 | 394 | 350 | 365 | 381 | 463 | 457 | 469 |
| 2020 | 494 | 549 | 539 | 473 | 372 | 382 | 385 | 400 | 375 | 363 | 381 | 407 |
| 2021 | 397 | 358 | 377 | 383 | 359 | 322 | 342 | 329 | 337 | 335 | 374 | 372 |
| 2022 | 393 | 405 | 383 | 352 | 356 | 382 | 367 | 370 | 371 | 351 | 363 | 374 |
| 2023 | 408 | 385 | 368 | 345 | 331 | 319 | 306 | 289 | 344 | 333 | 361 | 345 |
| 2024 | 351 | 354 | ||||||||||
| - = No Data Reported; -- = Not Applicable; NA = Not Available; W = Withheld to avoid disclosure of individual company data. |
| Release Date: 8/30/2024 |
| Next Release Date: 9/30/2024 |
Referring Pages: