|
Download Data (XLS File) |
|
|||||
|
|||||
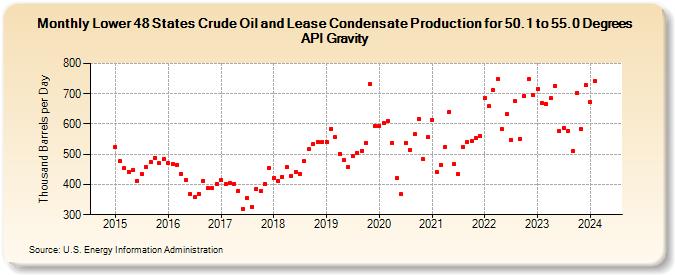
| Lower 48 States Crude Oil and Lease Condensate Production for 50.1 to 55.0 Degrees API Gravity (Thousand Barrels per Day) | |||||
| Year | Jan | Feb | Mar | Apr | May | Jun | Jul | Aug | Sep | Oct | Nov | Dec |
|---|---|---|---|---|---|---|---|---|---|---|---|---|
| 2015 | 524 | 475 | 453 | 442 | 446 | 412 | 435 | 458 | 473 | 488 | 470 | 484 |
| 2016 | 471 | 468 | 464 | 436 | 415 | 369 | 357 | 368 | 413 | 386 | 388 | 402 |
| 2017 | 414 | 399 | 405 | 403 | 379 | 319 | 356 | 327 | 385 | 376 | 403 | 455 |
| 2018 | 423 | 410 | 426 | 458 | 429 | 442 | 435 | 477 | 516 | 533 | 540 | 540 |
| 2019 | 542 | 583 | 556 | 502 | 480 | 458 | 493 | 504 | 512 | 537 | 732 | 594 |
| 2020 | 593 | 603 | 611 | 537 | 420 | 367 | 538 | 514 | 565 | 616 | 482 | 556 |
| 2021 | 613 | 441 | 464 | 522 | 639 | 466 | 433 | 523 | 541 | 541 | 551 | 558 |
| 2022 | 690 | 643 | 706 | 743 | 583 | 624 | 541 | 667 | 547 | 689 | 743 | 692 |
| 2023 | 717 | 670 | 665 | 688 | 726 | 577 | 584 | 576 | 513 | 705 | 584 | 729 |
| 2024 | 674 | 742 | ||||||||||
| - = No Data Reported; -- = Not Applicable; NA = Not Available; W = Withheld to avoid disclosure of individual company data. |
| Release Date: 4/30/2024 |
| Next Release Date: 5/31/2024 |
Referring Pages: