|
Download Data (XLS File) |
|
|||||
|
|||||
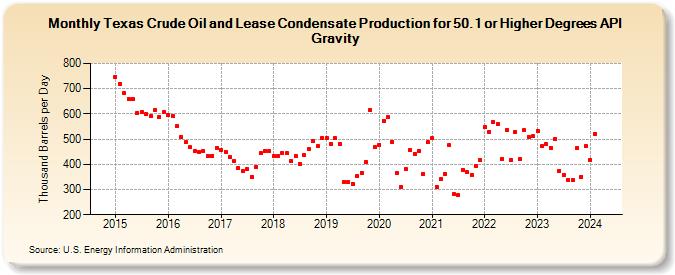
| Texas Crude Oil and Lease Condensate Production for 50.1 or Higher Degrees API Gravity (Thousand Barrels per Day) | |||||
| Year | Jan | Feb | Mar | Apr | May | Jun | Jul | Aug | Sep | Oct | Nov | Dec |
|---|---|---|---|---|---|---|---|---|---|---|---|---|
| 2015 | 747 | 719 | 683 | 659 | 661 | 605 | 608 | 599 | 591 | 614 | 588 | 606 |
| 2016 | 596 | 592 | 551 | 509 | 487 | 467 | 451 | 448 | 454 | 433 | 434 | 465 |
| 2017 | 456 | 450 | 427 | 414 | 386 | 373 | 382 | 350 | 391 | 443 | 453 | 452 |
| 2018 | 432 | 434 | 445 | 444 | 414 | 432 | 403 | 435 | 460 | 492 | 471 | 505 |
| 2019 | 506 | 480 | 503 | 482 | 331 | 329 | 323 | 352 | 366 | 410 | 615 | 467 |
| 2020 | 478 | 573 | 586 | 488 | 365 | 311 | 380 | 456 | 442 | 454 | 363 | 487 |
| 2021 | 503 | 311 | 340 | 363 | 475 | 282 | 278 | 379 | 368 | 357 | 392 | 416 |
| 2022 | 547 | 530 | 567 | 559 | 423 | 536 | 418 | 529 | 420 | 535 | 509 | 511 |
| 2023 | 534 | 472 | 479 | 466 | 501 | 375 | 359 | 338 | 337 | 464 | 351 | 476 |
| 2024 | 382 | |||||||||||
| - = No Data Reported; -- = Not Applicable; NA = Not Available; W = Withheld to avoid disclosure of individual company data. |
| Release Date: 3/29/2024 |
| Next Release Date: 4/30/2024 |
Referring Pages: