|
Download Data (XLS File) |
|
|||||
|
|||||
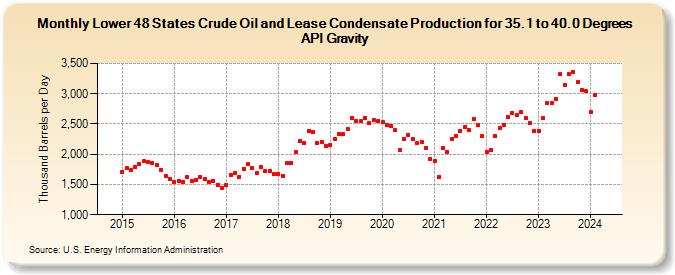
| Lower 48 States Crude Oil and Lease Condensate Production for 35.1 to 40.0 Degrees API Gravity (Thousand Barrels per Day) | |||||
| Year | Jan | Feb | Mar | Apr | May | Jun | Jul | Aug | Sep | Oct | Nov | Dec |
|---|---|---|---|---|---|---|---|---|---|---|---|---|
| 2015 | 1,713 | 1,776 | 1,736 | 1,790 | 1,840 | 1,892 | 1,869 | 1,852 | 1,827 | 1,745 | 1,642 | 1,596 |
| 2016 | 1,538 | 1,551 | 1,543 | 1,620 | 1,561 | 1,582 | 1,629 | 1,583 | 1,537 | 1,556 | 1,498 | 1,448 |
| 2017 | 1,499 | 1,655 | 1,691 | 1,631 | 1,762 | 1,831 | 1,777 | 1,682 | 1,788 | 1,715 | 1,728 | 1,665 |
| 2018 | 1,677 | 1,647 | 1,847 | 1,861 | 2,034 | 2,212 | 2,179 | 2,389 | 2,365 | 2,187 | 2,208 | 2,142 |
| 2019 | 2,157 | 2,258 | 2,334 | 2,331 | 2,423 | 2,599 | 2,554 | 2,548 | 2,601 | 2,520 | 2,559 | 2,548 |
| 2020 | 2,530 | 2,478 | 2,473 | 2,393 | 2,074 | 2,255 | 2,324 | 2,244 | 2,180 | 2,205 | 2,107 | 1,919 |
| 2021 | 1,895 | 1,631 | 2,106 | 2,040 | 2,255 | 2,304 | 2,392 | 2,444 | 2,404 | 2,589 | 2,483 | 2,303 |
| 2022 | 2,043 | 2,064 | 2,306 | 2,432 | 2,491 | 2,622 | 2,689 | 2,650 | 2,692 | 2,597 | 2,515 | 2,380 |
| 2023 | 2,389 | 2,602 | 2,851 | 2,844 | 2,920 | 3,327 | 3,150 | 3,326 | 3,355 | 3,195 | 3,062 | 3,036 |
| 2024 | 2,730 | |||||||||||
| - = No Data Reported; -- = Not Applicable; NA = Not Available; W = Withheld to avoid disclosure of individual company data. |
| Release Date: 3/29/2024 |
| Next Release Date: 4/30/2024 |
Referring Pages: