|
Download Data (XLS File) |
|
|||||
|
|||||
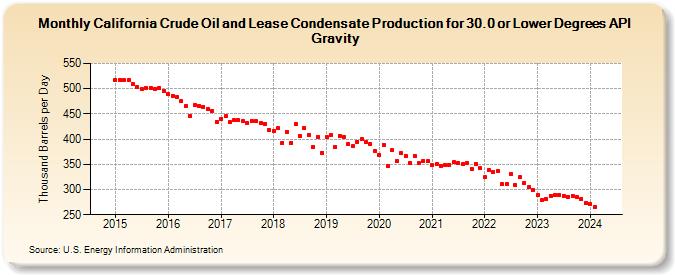
| California Crude Oil and Lease Condensate Production for 30.0 or Lower Degrees API Gravity (Thousand Barrels per Day) | |||||
| Year | Jan | Feb | Mar | Apr | May | Jun | Jul | Aug | Sep | Oct | Nov | Dec |
|---|---|---|---|---|---|---|---|---|---|---|---|---|
| 2015 | 517 | 517 | 518 | 517 | 510 | 503 | 500 | 502 | 502 | 499 | 501 | 496 |
| 2016 | 489 | 486 | 484 | 475 | 466 | 446 | 467 | 466 | 464 | 459 | 456 | 434 |
| 2017 | 440 | 445 | 434 | 437 | 437 | 435 | 432 | 436 | 435 | 431 | 430 | 419 |
| 2018 | 416 | 422 | 393 | 415 | 393 | 429 | 407 | 422 | 409 | 385 | 405 | 373 |
| 2019 | 404 | 409 | 385 | 407 | 405 | 390 | 386 | 395 | 400 | 395 | 390 | 376 |
| 2020 | 369 | 389 | 347 | 378 | 357 | 372 | 367 | 353 | 366 | 352 | 357 | 356 |
| 2021 | 348 | 350 | 347 | 349 | 349 | 354 | 353 | 351 | 353 | 341 | 351 | 342 |
| 2022 | 324 | 338 | 335 | 337 | 310 | 310 | 331 | 309 | 324 | 313 | 304 | 300 |
| 2023 | 289 | 280 | 282 | 288 | 290 | 289 | 288 | 286 | 288 | 285 | 282 | 273 |
| 2024 | 270 | |||||||||||
| - = No Data Reported; -- = Not Applicable; NA = Not Available; W = Withheld to avoid disclosure of individual company data. |
| Release Date: 3/29/2024 |
| Next Release Date: 4/30/2024 |
Referring Pages: