|
Download Data (XLS File) |
|
|||||
|
|||||
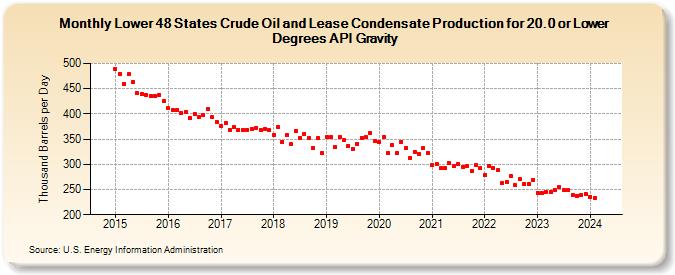
| Lower 48 States Crude Oil and Lease Condensate Production for 20.0 or Lower Degrees API Gravity (Thousand Barrels per Day) | |||||
| Year | Jan | Feb | Mar | Apr | May | Jun | Jul | Aug | Sep | Oct | Nov | Dec |
|---|---|---|---|---|---|---|---|---|---|---|---|---|
| 2015 | 489 | 480 | 460 | 479 | 464 | 441 | 440 | 438 | 435 | 435 | 438 | 426 |
| 2016 | 411 | 408 | 408 | 401 | 404 | 391 | 400 | 393 | 397 | 409 | 393 | 384 |
| 2017 | 376 | 382 | 369 | 374 | 369 | 369 | 369 | 371 | 373 | 368 | 371 | 368 |
| 2018 | 359 | 374 | 345 | 358 | 340 | 367 | 352 | 361 | 353 | 332 | 352 | 322 |
| 2019 | 354 | 354 | 334 | 354 | 348 | 337 | 331 | 341 | 353 | 354 | 362 | 346 |
| 2020 | 344 | 354 | 322 | 338 | 323 | 345 | 332 | 313 | 325 | 321 | 333 | 323 |
| 2021 | 298 | 301 | 292 | 293 | 302 | 296 | 300 | 295 | 297 | 287 | 298 | 292 |
| 2022 | 278 | 297 | 293 | 288 | 262 | 265 | 276 | 258 | 270 | 260 | 261 | 269 |
| 2023 | 244 | 244 | 246 | 245 | 250 | 255 | 249 | 250 | 240 | 238 | 240 | 241 |
| 2024 | 235 | |||||||||||
| - = No Data Reported; -- = Not Applicable; NA = Not Available; W = Withheld to avoid disclosure of individual company data. |
| Release Date: 3/29/2024 |
| Next Release Date: 4/30/2024 |
Referring Pages: