|
Download Data (XLS File) |
|
||||||||
|
||||||||
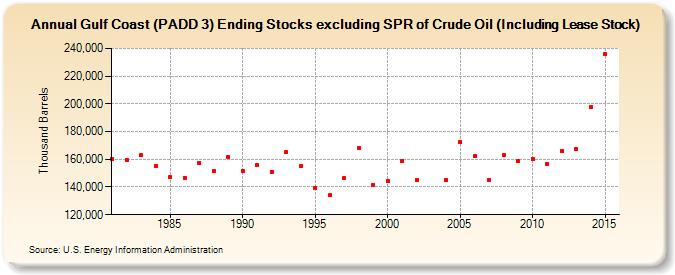
| Gulf Coast (PADD 3) Ending Stocks excluding SPR of Crude Oil (Including Lease Stock) (Thousand Barrels) | ||||||||
| Decade | Year-0 | Year-1 | Year-2 | Year-3 | Year-4 | Year-5 | Year-6 | Year-7 | Year-8 | Year-9 |
|---|---|---|---|---|---|---|---|---|---|---|
| 1980's | 160,208 | 159,754 | 162,732 | 155,214 | 147,164 | 146,704 | 157,570 | 151,896 | 161,865 | |
| 1990's | 151,451 | 155,671 | 150,976 | 165,148 | 154,904 | 139,602 | 134,027 | 146,621 | 168,078 | 141,411 |
| 2000's | 144,501 | 159,051 | 145,004 | 145,064 | 172,339 | 162,696 | 145,094 | 163,051 | 158,588 | |
| 2010's | 159,970 | 156,822 | 166,065 | 167,724 | 197,743 | 235,888 |
| - = No Data Reported; -- = Not Applicable; NA = Not Available; W = Withheld to avoid disclosure of individual company data. |
| Release Date: 8/30/2024 |
| Next Release Date: 8/29/2025 |