|
Download Data (XLS File) |
|
||||||||
|
||||||||
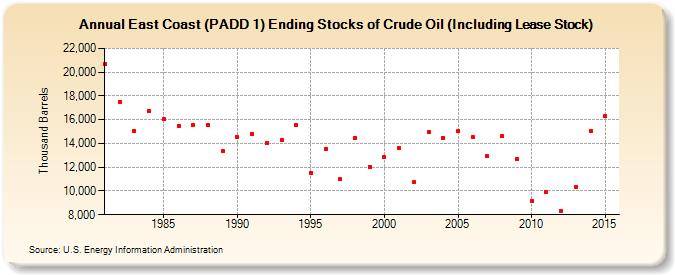
| East Coast (PADD 1) Ending Stocks of Crude Oil (Including Lease Stock) (Thousand Barrels) | ||||||||
| Decade | Year-0 | Year-1 | Year-2 | Year-3 | Year-4 | Year-5 | Year-6 | Year-7 | Year-8 | Year-9 |
|---|---|---|---|---|---|---|---|---|---|---|
| 1980's | 20,691 | 17,512 | 15,057 | 16,730 | 16,042 | 15,508 | 15,535 | 15,559 | 13,367 | |
| 1990's | 14,520 | 14,779 | 14,027 | 14,320 | 15,555 | 11,534 | 13,537 | 10,973 | 14,460 | 12,037 |
| 2000's | 12,843 | 13,575 | 10,713 | 14,954 | 14,475 | 15,019 | 14,512 | 12,909 | 14,613 | 12,672 |
| 2010's | 9,186 | 9,902 | 8,328 | 10,318 | 15,075 | 16,298 |
| - = No Data Reported; -- = Not Applicable; NA = Not Available; W = Withheld to avoid disclosure of individual company data. |
| Release Date: 8/30/2024 |
| Next Release Date: 8/29/2025 |