|
Download Data (XLS File) |
|
||||||||
|
||||||||
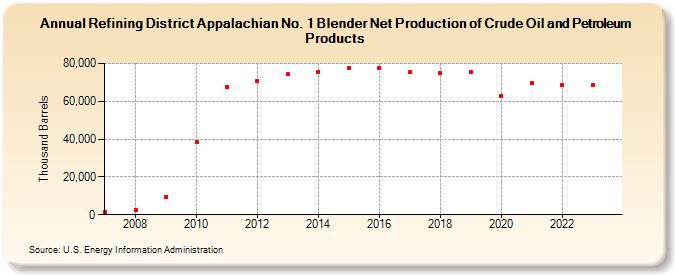
| Refining District Appalachian No. 1 Blender Net Production of Crude Oil and Petroleum Products (Thousand Barrels) | ||||||||
| Decade | Year-0 | Year-1 | Year-2 | Year-3 | Year-4 | Year-5 | Year-6 | Year-7 | Year-8 | Year-9 |
|---|---|---|---|---|---|---|---|---|---|---|
| 2000's | 1,281 | 2,749 | 9,488 | |||||||
| 2010's | 38,660 | 67,707 | 70,630 | 74,264 | 75,587 | 77,660 | 77,810 | 75,405 | 74,835 | 75,629 |
| 2020's | 63,059 | 69,898 | 68,682 | 69,116 |
| - = No Data Reported; -- = Not Applicable; NA = Not Available; W = Withheld to avoid disclosure of individual company data. |
| Release Date: 8/30/2024 |
| Next Release Date: 8/29/2025 |