|
Download Data (XLS File) |
|
||||||||
|
||||||||
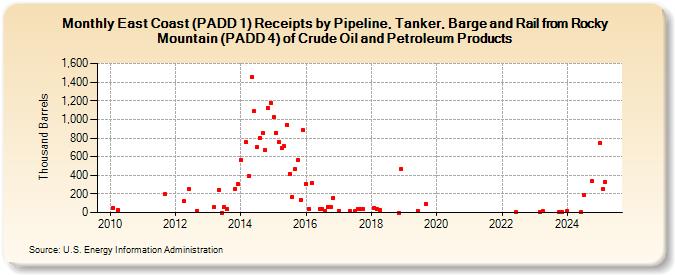
| East Coast (PADD 1) Receipts by Pipeline, Tanker, Barge and Rail from Rocky Mountain (PADD 4) of Crude Oil and Petroleum Products (Thousand Barrels) | ||||||||
| Year | Jan | Feb | Mar | Apr | May | Jun | Jul | Aug | Sep | Oct | Nov | Dec |
|---|---|---|---|---|---|---|---|---|---|---|---|---|
| 2010 | 52 | 26 | ||||||||||
| 2011 | 194 | |||||||||||
| 2012 | 119 | 253 | 20 | |||||||||
| 2013 | 59 | 241 | 0 | 60 | 40 | 257 | 309 | |||||
| 2014 | 562 | 753 | 388 | 1,454 | 1,086 | 707 | 801 | 853 | 671 | 1,127 | 1,179 | |
| 2015 | 1,024 | 858 | 759 | 693 | 710 | 944 | 419 | 168 | 467 | 565 | 140 | 886 |
| 2016 | 306 | 40 | 317 | 39 | 40 | 20 | 60 | 60 | 160 | |||
| 2017 | 20 | 19 | 19 | 38 | 38 | 39 | ||||||
| 2018 | 52 | 39 | 26 | 0 | 470 | |||||||
| 2019 | 20 | 95 | ||||||||||
| 2022 | 5 | |||||||||||
| 2023 | 5 | 13 | 2 | 2 | ||||||||
| 2024 | 18 | |||||||||||
| - = No Data Reported; -- = Not Applicable; NA = Not Available; W = Withheld to avoid disclosure of individual company data. |
| Release Date: 6/28/2024 |
| Next Release Date: 7/31/2024 |