|
Download Data (XLS File) |
|
||||||||
|
||||||||
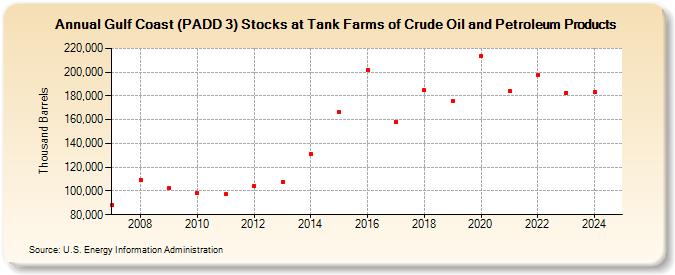
| Gulf Coast (PADD 3) Stocks at Tank Farms of Crude Oil and Petroleum Products (Thousand Barrels) | ||||||||
| Decade | Year-0 | Year-1 | Year-2 | Year-3 | Year-4 | Year-5 | Year-6 | Year-7 | Year-8 | Year-9 |
|---|---|---|---|---|---|---|---|---|---|---|
| 2000's | 87,982 | 109,484 | 102,140 | |||||||
| 2010's | 97,960 | 97,142 | 104,234 | 107,436 | 131,155 | 166,542 | 201,704 | 158,416 | 184,560 | 175,420 |
| 2020's | 213,597 | 184,253 | 197,720 | 182,830 | 183,640 |
| - = No Data Reported; -- = Not Applicable; NA = Not Available; W = Withheld to avoid disclosure of individual company data. |
| Release Date: 6/30/2025 |
| Next Release Date: 8/29/2025 |