|
Download Data (XLS File) |
|
||||||||
|
||||||||
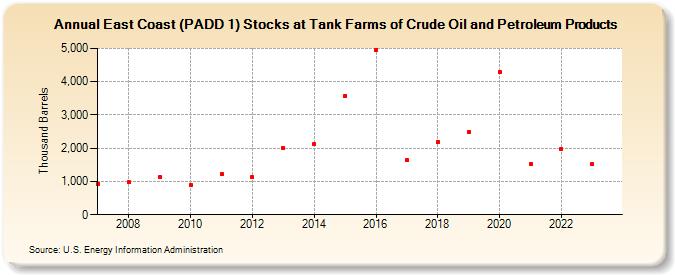
| East Coast (PADD 1) Stocks at Tank Farms of Crude Oil and Petroleum Products (Thousand Barrels) | ||||||||
| Decade | Year-0 | Year-1 | Year-2 | Year-3 | Year-4 | Year-5 | Year-6 | Year-7 | Year-8 | Year-9 |
|---|---|---|---|---|---|---|---|---|---|---|
| 2000's | 925 | 970 | 1,123 | |||||||
| 2010's | 889 | 1,220 | 1,125 | 2,012 | 2,118 | 3,580 | 4,965 | 1,641 | 2,191 | 2,494 |
| 2020's | 4,299 | 1,523 | 1,970 | 1,515 |
| - = No Data Reported; -- = Not Applicable; NA = Not Available; W = Withheld to avoid disclosure of individual company data. |
| Release Date: 3/29/2024 |
| Next Release Date: 8/30/2024 |