|
Download Data (XLS File) |
|
||||||||
|
||||||||
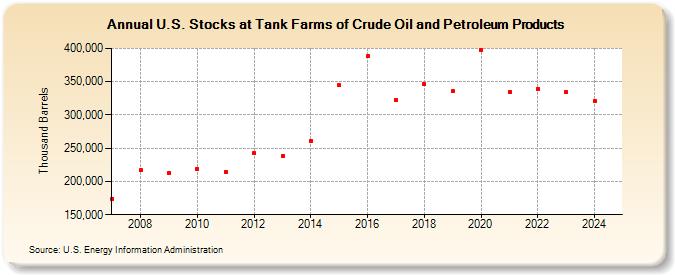
| U.S. Stocks at Tank Farms of Crude Oil and Petroleum Products (Thousand Barrels) | ||||||||
| Decade | Year-0 | Year-1 | Year-2 | Year-3 | Year-4 | Year-5 | Year-6 | Year-7 | Year-8 | Year-9 |
|---|---|---|---|---|---|---|---|---|---|---|
| 2000's | 174,050 | 216,550 | 212,168 | |||||||
| 2010's | 218,783 | 214,430 | 242,665 | 238,499 | 261,120 | 344,259 | 387,832 | 321,901 | 346,307 | 335,628 |
| 2020's | 397,861 | 334,801 | 339,599 | 334,213 | 320,990 |
| - = No Data Reported; -- = Not Applicable; NA = Not Available; W = Withheld to avoid disclosure of individual company data. |
| Release Date: 6/30/2025 |
| Next Release Date: 8/29/2025 |