|
Download Data (XLS File) |
|
||||||||
|
||||||||
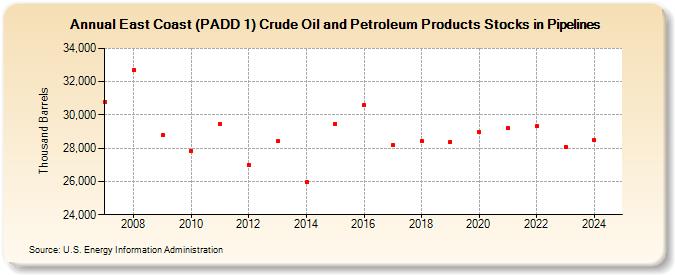
| East Coast (PADD 1) Crude Oil and Petroleum Products Stocks in Pipelines (Thousand Barrels) | ||||||||
| Decade | Year-0 | Year-1 | Year-2 | Year-3 | Year-4 | Year-5 | Year-6 | Year-7 | Year-8 | Year-9 |
|---|---|---|---|---|---|---|---|---|---|---|
| 2000's | 30,792 | 32,702 | 28,765 | |||||||
| 2010's | 27,847 | 29,425 | 27,011 | 28,410 | 25,940 | 29,479 | 30,573 | 28,190 | 28,427 | 28,393 |
| 2020's | 28,960 | 29,209 | 29,307 | 28,078 |
| - = No Data Reported; -- = Not Applicable; NA = Not Available; W = Withheld to avoid disclosure of individual company data. |
| Release Date: 8/30/2024 |
| Next Release Date: 8/29/2025 |