|
Download Data (XLS File) |
|
||||||||
|
||||||||
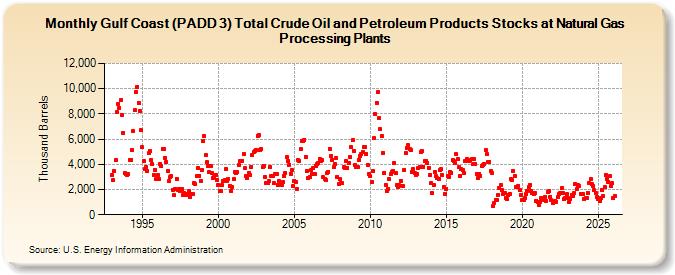
| Gulf Coast (PADD 3) Total Crude Oil and Petroleum Products Stocks at Natural Gas Processing Plants (Thousand Barrels) | ||||||||
| Year | Jan | Feb | Mar | Apr | May | Jun | Jul | Aug | Sep | Oct | Nov | Dec |
|---|---|---|---|---|---|---|---|---|---|---|---|---|
| 1993 | 3,147 | 2,723 | 3,441 | 4,304 | 8,125 | 8,799 | 8,503 | 9,075 | 7,877 | 6,522 | 3,298 | 3,220 |
| 1994 | 3,128 | 3,208 | 4,355 | 4,371 | 5,116 | 6,605 | 8,277 | 9,756 | 10,155 | 8,879 | 8,248 | 6,712 |
| 1995 | 5,338 | 4,248 | 3,617 | 3,805 | 3,455 | 4,859 | 5,088 | 4,355 | 4,005 | 3,166 | 3,580 | 2,842 |
| 1996 | 3,176 | 2,804 | 4,061 | 3,865 | 5,236 | 5,245 | 4,525 | 4,181 | 3,468 | 2,652 | 3,006 | 3,087 |
| 1997 | 1,983 | 1,536 | 2,048 | 2,873 | 1,928 | 2,020 | 1,907 | 2,039 | 1,542 | 1,749 | 1,647 | 1,557 |
| 1998 | 1,640 | 1,843 | 1,411 | 1,667 | 1,630 | 2,519 | 2,415 | 3,089 | 3,709 | 3,110 | 2,698 | 3,555 |
| 1999 | 5,817 | 6,218 | 4,708 | 4,145 | 3,863 | 3,355 | 3,852 | 3,288 | 2,947 | 2,978 | 3,183 | 2,756 |
| 2000 | 2,383 | 1,853 | 1,915 | 2,330 | 2,673 | 2,736 | 3,645 | 2,684 | 2,853 | 2,301 | 1,904 | 2,209 |
| 2001 | 2,826 | 3,390 | 3,280 | 3,365 | 3,940 | 4,250 | 4,290 | 4,275 | 4,833 | 3,692 | 3,091 | 2,905 |
| 2002 | 3,298 | 3,140 | 3,809 | 4,753 | 4,972 | 5,077 | 5,121 | 6,264 | 6,361 | 5,173 | 5,219 | 3,749 |
| 2003 | 3,899 | 3,007 | 2,513 | 2,477 | 2,640 | 3,797 | 3,040 | 3,077 | 2,495 | 3,267 | 3,198 | 2,396 |
| 2004 | 2,660 | 2,320 | 2,377 | 2,590 | 3,062 | 3,318 | 4,550 | 4,249 | 3,970 | 3,249 | 3,523 | 2,291 |
| 2005 | 2,683 | 2,611 | 2,065 | 4,360 | 4,268 | 5,207 | 5,837 | 5,826 | 5,959 | 4,597 | 3,464 | 2,878 |
| 2006 | 2,979 | 3,511 | 3,240 | 3,732 | 3,218 | 3,862 | 3,985 | 4,082 | 4,444 | 4,274 | 4,340 | 2,963 |
| 2007 | 2,818 | 2,753 | 3,285 | 3,428 | 5,233 | 4,697 | 4,355 | 3,780 | 4,050 | 4,512 | 2,964 | 2,457 |
| 2008 | 2,804 | 2,500 | 2,486 | 3,780 | 3,703 | 4,276 | 3,726 | 4,108 | 4,575 | 5,346 | 5,902 | 5,076 |
| 2009 | 3,936 | 3,763 | 3,766 | 4,380 | 4,633 | 4,857 | 4,987 | 5,340 | 5,343 | 4,830 | 3,947 | 3,239 |
| 2010 | 3,044 | 2,585 | 3,434 | 6,049 | 8,006 | 8,885 | 9,722 | 7,640 | 6,766 | 6,258 | 4,923 | 3,331 |
| 2011 | 2,342 | 1,851 | 2,059 | 2,805 | 3,243 | 3,426 | 3,505 | 4,094 | 3,283 | 2,337 | 2,162 | 2,357 |
| 2012 | 2,705 | 2,314 | 2,246 | 3,569 | 4,922 | 5,331 | 5,494 | 5,232 | 5,122 | 3,387 | 3,596 | 3,304 |
| 2013 | 3,182 | 3,232 | 3,746 | 3,810 | 5,007 | 5,029 | 3,820 | 4,246 | 4,273 | 4,123 | 3,732 | 3,174 |
| 2014 | 2,530 | 1,712 | 2,319 | 3,403 | 3,065 | 2,892 | 2,870 | 3,514 | 3,591 | 3,138 | 2,181 | 1,655 |
| 2015 | 2,061 | 3,101 | 3,001 | 3,413 | 3,345 | 4,313 | 4,241 | 4,078 | 4,780 | 4,401 | 3,763 | 3,104 |
| 2016 | 3,640 | 3,532 | 3,278 | 4,263 | 4,428 | 4,331 | 4,298 | 4,339 | 4,397 | 3,999 | 4,406 | 4,019 |
| 2017 | 3,239 | 2,912 | 3,266 | 3,103 | 3,859 | 3,935 | 4,054 | 5,112 | 4,789 | 4,179 | 4,212 | 3,451 |
| 2018 | 3,317 | 687 | 958 | 1,186 | 1,183 | 1,570 | 2,106 | 2,336 | 1,987 | 1,667 | 1,723 | 1,359 |
| 2019 | 1,236 | 1,541 | 1,674 | 2,822 | 2,773 | 3,500 | 3,077 | 2,204 | 2,232 | 2,315 | 1,927 | 1,551 |
| 2020 | 1,145 | 1,142 | 1,341 | 1,629 | 1,886 | 2,195 | 2,383 | 1,914 | 1,698 | 1,625 | 1,718 | 1,111 |
| 2021 | 1,005 | 737 | 1,009 | 1,332 | 1,192 | 1,364 | 1,439 | 1,111 | 1,786 | 1,868 | 1,422 | 1,128 |
| 2022 | 890 | 1,014 | 1,109 | 1,014 | 1,441 | 1,641 | 1,734 | 2,104 | 1,705 | 1,221 | 1,319 | 1,616 |
| 2023 | 1,309 | 1,031 | 1,216 | 1,596 | 1,466 | 1,729 | 2,423 | 2,046 | 2,342 | 2,292 | 1,665 | 1,608 |
| - = No Data Reported; -- = Not Applicable; NA = Not Available; W = Withheld to avoid disclosure of individual company data. |
| Release Date: 6/28/2024 |
| Next Release Date: 7/31/2024 |