|
Download Data (XLS File) |
|
||||||||
|
||||||||
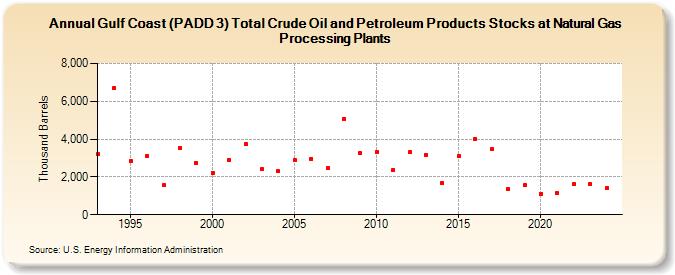
| Gulf Coast (PADD 3) Total Crude Oil and Petroleum Products Stocks at Natural Gas Processing Plants (Thousand Barrels) | ||||||||
| Decade | Year-0 | Year-1 | Year-2 | Year-3 | Year-4 | Year-5 | Year-6 | Year-7 | Year-8 | Year-9 |
|---|---|---|---|---|---|---|---|---|---|---|
| 1990's | 3,220 | 6,712 | 2,842 | 3,087 | 1,557 | 3,555 | 2,756 | |||
| 2000's | 2,209 | 2,905 | 3,749 | 2,396 | 2,291 | 2,878 | 2,963 | 2,457 | 5,076 | 3,239 |
| 2010's | 3,331 | 2,357 | 3,304 | 3,174 | 1,655 | 3,104 | 4,019 | 3,451 | 1,359 | 1,551 |
| 2020's | 1,111 | 1,128 | 1,616 | 1,608 |
| - = No Data Reported; -- = Not Applicable; NA = Not Available; W = Withheld to avoid disclosure of individual company data. |
| Release Date: 3/29/2024 |
| Next Release Date: 8/30/2024 |