|
Download Data (XLS File) |
|
||||||||
|
||||||||
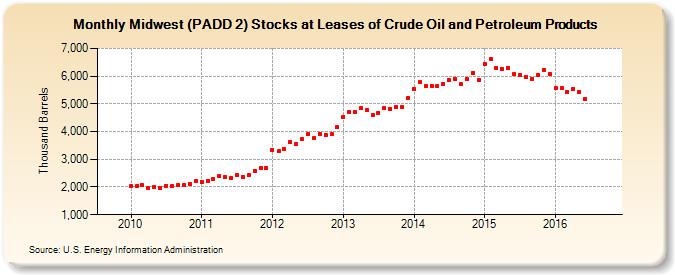
| Midwest (PADD 2) Stocks at Leases of Crude Oil and Petroleum Products (Thousand Barrels) | ||||||||
| Year | Jan | Feb | Mar | Apr | May | Jun | Jul | Aug | Sep | Oct | Nov | Dec |
|---|---|---|---|---|---|---|---|---|---|---|---|---|
| 2010 | 2,036 | 2,037 | 2,057 | 1,955 | 1,984 | 1,953 | 2,045 | 2,038 | 2,059 | 2,070 | 2,119 | 2,218 |
| 2011 | 2,182 | 2,221 | 2,299 | 2,379 | 2,371 | 2,341 | 2,437 | 2,377 | 2,419 | 2,579 | 2,675 | 2,686 |
| 2012 | 3,344 | 3,284 | 3,377 | 3,620 | 3,537 | 3,719 | 3,898 | 3,752 | 3,904 | 3,891 | 3,902 | 4,151 |
| 2013 | 4,541 | 4,703 | 4,721 | 4,839 | 4,786 | 4,601 | 4,676 | 4,843 | 4,817 | 4,896 | 4,902 | 5,224 |
| 2014 | 5,527 | 5,773 | 5,635 | 5,657 | 5,632 | 5,730 | 5,847 | 5,911 | 5,704 | 5,895 | 6,128 | 5,874 |
| 2015 | 6,439 | 6,618 | 6,298 | 6,253 | 6,305 | 6,065 | 6,048 | 5,968 | 5,910 | 6,025 | 6,226 | 6,089 |
| 2016 | 5,554 | 5,576 | 5,419 | 5,541 | 5,422 | 5,189 | ||||||
| - = No Data Reported; -- = Not Applicable; NA = Not Available; W = Withheld to avoid disclosure of individual company data. |
| Release Date: 3/29/2024 |
| Next Release Date: 4/30/2024 |