|
Download Data (XLS File) |
|
||||||||
|
||||||||
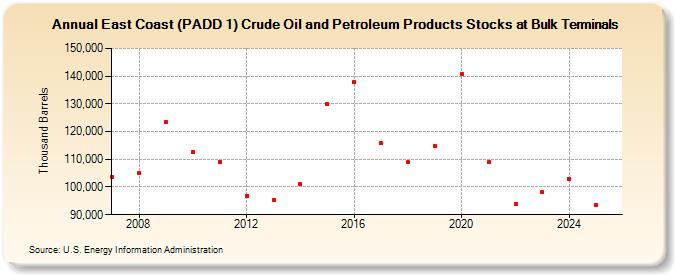
| East Coast (PADD 1) Crude Oil and Petroleum Products Stocks at Bulk Terminals (Thousand Barrels) | ||||||||
| Decade | Year-0 | Year-1 | Year-2 | Year-3 | Year-4 | Year-5 | Year-6 | Year-7 | Year-8 | Year-9 |
|---|---|---|---|---|---|---|---|---|---|---|
| 2000's | 103,519 | 105,209 | 123,371 | |||||||
| 2010's | 112,638 | 109,173 | 96,773 | 95,344 | 100,973 | 129,814 | 137,861 | 115,697 | 108,836 | 114,818 |
| 2020's | 140,646 | 108,901 | 93,901 | 98,139 |
| - = No Data Reported; -- = Not Applicable; NA = Not Available; W = Withheld to avoid disclosure of individual company data. |
| Release Date: 8/30/2024 |
| Next Release Date: 8/29/2025 |