|
Download Data (XLS File) |
|
||||||||
|
||||||||
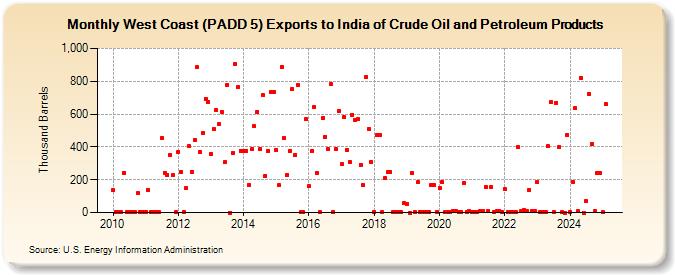
| West Coast (PADD 5) Exports to India of Crude Oil and Petroleum Products (Thousand Barrels) | ||||||||
| Year | Jan | Feb | Mar | Apr | May | Jun | Jul | Aug | Sep | Oct | Nov | Dec |
|---|---|---|---|---|---|---|---|---|---|---|---|---|
| 2010 | 138 | 1 | 1 | 2 | 244 | 1 | 2 | 1 | 1 | 117 | 1 | 1 |
| 2011 | 2 | 137 | 2 | 1 | 2 | 1 | 456 | 243 | 228 | 353 | 228 | 1 |
| 2012 | 370 | 250 | 4 | 148 | 403 | 250 | 444 | 884 | 368 | 485 | 693 | 675 |
| 2013 | 358 | 508 | 624 | 537 | 615 | 307 | 779 | 0 | 364 | 905 | 765 | 377 |
| 2014 | 373 | 377 | 170 | 385 | 525 | 615 | 387 | 716 | 225 | 377 | 733 | 732 |
| 2015 | 383 | 165 | 887 | 454 | 231 | 375 | 754 | 351 | 779 | 3 | 1 | 568 |
| 2016 | 159 | 375 | 644 | 242 | 3 | 573 | 462 | 386 | 781 | 5 | 385 | 618 |
| 2017 | 294 | 582 | 382 | 307 | 597 | 565 | 567 | 292 | 167 | 825 | 512 | 307 |
| 2018 | 3 | 470 | 472 | 1 | 210 | 246 | 247 | 4 | 6 | 1 | 1 | 59 |
| 2019 | 54 | 0 | 242 | 1 | 184 | 3 | 2 | 6 | 2 | 169 | 165 | 3 |
| 2020 | 151 | 185 | 3 | 2 | 1 | 10 | 9 | 3 | 2 | 181 | 4 | 9 |
| 2021 | 4 | 4 | 6 | 7 | 11 | 156 | 10 | 156 | 5 | 7 | 10 | 4 |
| 2022 | 141 | 2 | 3 | 5 | 4 | 398 | 10 | 16 | 9 | 140 | 9 | 10 |
| 2023 | 316 | 3 | 6 | 5 | 5 | 671 | 4 | 647 | 398 | 1 | 0 | 473 |
| 2024 | 3 | |||||||||||
| - = No Data Reported; -- = Not Applicable; NA = Not Available; W = Withheld to avoid disclosure of individual company data. |
| Release Date: 3/29/2024 |
| Next Release Date: 4/30/2024 |