|
Download Data (XLS File) |
|
||||||||
|
||||||||
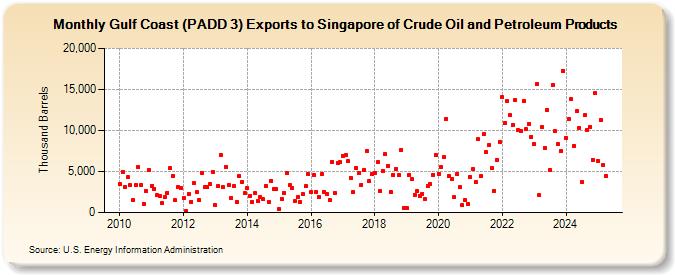
| Gulf Coast (PADD 3) Exports to Singapore of Crude Oil and Petroleum Products (Thousand Barrels) | ||||||||
| Year | Jan | Feb | Mar | Apr | May | Jun | Jul | Aug | Sep | Oct | Nov | Dec |
|---|---|---|---|---|---|---|---|---|---|---|---|---|
| 2010 | 3,429 | 4,972 | 3,158 | 4,277 | 3,312 | 1,517 | 3,340 | 5,558 | 3,369 | 1,078 | 2,636 | 5,180 |
| 2011 | 3,275 | 2,914 | 2,128 | 2,014 | 1,145 | 1,847 | 2,425 | 5,422 | 4,494 | 1,496 | 3,133 | 3,032 |
| 2012 | 1,788 | 216 | 2,260 | 1,333 | 3,595 | 2,498 | 1,517 | 4,822 | 3,057 | 3,075 | 3,419 | 4,912 |
| 2013 | 889 | 3,217 | 7,062 | 3,080 | 5,595 | 3,309 | 1,812 | 3,255 | 1,347 | 4,493 | 3,764 | 2,336 |
| 2014 | 3,009 | 2,051 | 1,297 | 2,332 | 1,402 | 1,888 | 1,593 | 3,287 | 1,304 | 3,892 | 2,827 | 2,828 |
| 2015 | 407 | 1,712 | 2,431 | 4,761 | 3,302 | 2,997 | 1,394 | 1,846 | 1,308 | 2,265 | 3,191 | 4,667 |
| 2016 | 2,554 | 4,591 | 2,498 | 1,884 | 4,655 | 2,551 | 2,311 | 1,573 | 6,209 | 2,404 | 6,014 | 6,099 |
| 2017 | 6,950 | 7,012 | 6,225 | 4,252 | 2,486 | 5,446 | 4,784 | 3,401 | 5,189 | 7,453 | 3,794 | 4,662 |
| 2018 | 4,846 | 6,128 | 2,572 | 5,094 | 7,077 | 5,705 | 2,512 | 4,582 | 5,353 | 4,527 | 7,670 | 564 |
| 2019 | 555 | 4,598 | 4,048 | 2,174 | 2,609 | 2,052 | 2,295 | 1,668 | 3,293 | 3,474 | 4,572 | 7,022 |
| 2020 | 4,754 | 5,576 | 6,728 | 11,419 | 4,410 | 4,135 | 1,858 | 4,725 | 3,095 | 870 | 1,513 | 1,034 |
| 2021 | 4,362 | 5,284 | 3,698 | 8,908 | 4,459 | 9,511 | 7,365 | 8,248 | 5,420 | 2,644 | 6,429 | 8,646 |
| 2022 | 14,019 | 10,923 | 13,532 | 11,857 | 10,685 | 13,751 | 10,007 | 9,990 | 13,567 | 10,123 | 10,805 | 9,229 |
| 2023 | 9,456 | 14,310 | 2,136 | 10,181 | 7,874 | 10,206 | 6,332 | 12,327 | 10,198 | 8,140 | 8,392 | 16,601 |
| 2024 | 9,143 | |||||||||||
| - = No Data Reported; -- = Not Applicable; NA = Not Available; W = Withheld to avoid disclosure of individual company data. |
| Release Date: 3/29/2024 |
| Next Release Date: 4/30/2024 |