|
Download Data (XLS File) |
|
||||||||
|
||||||||
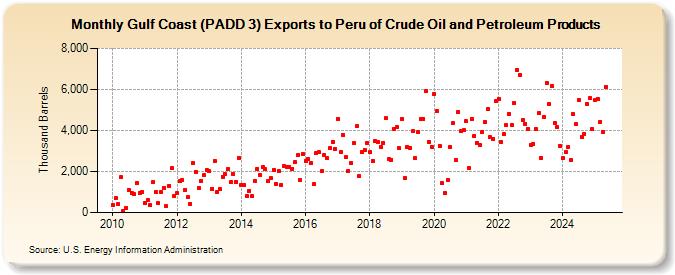
| Gulf Coast (PADD 3) Exports to Peru of Crude Oil and Petroleum Products (Thousand Barrels) | ||||||||
| Year | Jan | Feb | Mar | Apr | May | Jun | Jul | Aug | Sep | Oct | Nov | Dec |
|---|---|---|---|---|---|---|---|---|---|---|---|---|
| 2010 | 380 | 694 | 420 | 1,710 | 77 | 237 | 1,107 | 932 | 888 | 1,445 | 966 | 1,007 |
| 2011 | 460 | 590 | 370 | 1,482 | 995 | 465 | 1,025 | 1,218 | 306 | 1,307 | 2,149 | 812 |
| 2012 | 940 | 1,522 | 1,584 | 1,108 | 742 | 431 | 2,395 | 1,991 | 1,191 | 1,529 | 1,834 | 2,066 |
| 2013 | 2,011 | 1,159 | 2,532 | 1,020 | 1,138 | 1,746 | 1,888 | 2,114 | 1,473 | 1,884 | 1,513 | 2,663 |
| 2014 | 1,355 | 1,338 | 806 | 1,068 | 787 | 1,527 | 2,123 | 1,848 | 2,204 | 2,110 | 1,522 | 1,680 |
| 2015 | 2,076 | 1,398 | 2,025 | 1,358 | 2,247 | 2,237 | 2,222 | 2,147 | 2,446 | 2,782 | 1,610 | 2,844 |
| 2016 | 2,526 | 2,620 | 2,393 | 1,372 | 2,912 | 2,934 | 2,006 | 2,799 | 2,653 | 3,129 | 3,462 | 3,100 |
| 2017 | 4,578 | 2,940 | 3,792 | 2,688 | 2,044 | 2,408 | 3,386 | 4,194 | 1,766 | 2,938 | 3,063 | 3,372 |
| 2018 | 2,935 | 2,530 | 3,478 | 3,453 | 3,215 | 3,404 | 4,593 | 2,599 | 2,574 | 4,085 | 4,152 | 3,132 |
| 2019 | 4,565 | 1,671 | 3,203 | 3,146 | 3,956 | 2,654 | 3,902 | 4,563 | 4,563 | 5,902 | 3,458 | 3,205 |
| 2020 | 5,776 | 4,928 | 3,254 | 1,418 | 932 | 1,580 | 3,197 | 4,342 | 2,550 | 4,917 | 3,956 | 4,009 |
| 2021 | 4,444 | 2,167 | 4,570 | 3,745 | 3,409 | 3,305 | 3,935 | 4,406 | 5,029 | 3,672 | 3,585 | 5,422 |
| 2022 | 5,536 | 3,436 | 3,806 | 4,256 | 4,810 | 4,277 | 5,348 | 6,940 | 6,681 | 4,518 | 4,335 | 4,072 |
| 2023 | 3,704 | 3,099 | 4,403 | 4,578 | 3,427 | 4,408 | 6,840 | 4,984 | 6,168 | 4,341 | 4,174 | 4,489 |
| 2024 | 2,650 | 2,945 | 3,205 | 2,582 | ||||||||
| - = No Data Reported; -- = Not Applicable; NA = Not Available; W = Withheld to avoid disclosure of individual company data. |
| Release Date: 6/28/2024 |
| Next Release Date: 7/31/2024 |