|
Download Data (XLS File) |
|
||||||||
|
||||||||
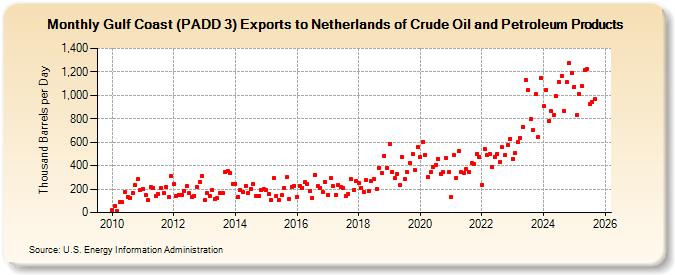
| Gulf Coast (PADD 3) Exports to Netherlands of Crude Oil and Petroleum Products (Thousand Barrels per Day) | ||||||||
| Year | Jan | Feb | Mar | Apr | May | Jun | Jul | Aug | Sep | Oct | Nov | Dec |
|---|---|---|---|---|---|---|---|---|---|---|---|---|
| 2010 | 22 | 55 | 14 | 88 | 87 | 177 | 133 | 123 | 170 | 234 | 282 | 193 |
| 2011 | 203 | 149 | 103 | 218 | 213 | 138 | 161 | 211 | 168 | 216 | 130 | 311 |
| 2012 | 243 | 144 | 152 | 153 | 184 | 225 | 164 | 134 | 142 | 221 | 261 | 311 |
| 2013 | 107 | 164 | 138 | 196 | 112 | 124 | 169 | 164 | 343 | 351 | 338 | 246 |
| 2014 | 247 | 134 | 190 | 174 | 225 | 169 | 200 | 247 | 141 | 138 | 195 | 205 |
| 2015 | 191 | 159 | 108 | 294 | 142 | 106 | 146 | 212 | 300 | 116 | 222 | 228 |
| 2016 | 133 | 228 | 210 | 258 | 242 | 183 | 126 | 322 | 225 | 212 | 175 | 262 |
| 2017 | 154 | 292 | 224 | 148 | 235 | 219 | 208 | 145 | 162 | 282 | 191 | 269 |
| 2018 | 251 | 211 | 177 | 278 | 180 | 267 | 286 | 205 | 380 | 336 | 486 | 377 |
| 2019 | 585 | 349 | 292 | 333 | 234 | 472 | 283 | 345 | 424 | 497 | 359 | 559 |
| 2020 | 472 | 602 | 491 | 301 | 344 | 389 | 406 | 457 | 332 | 342 | 467 | 343 |
| 2021 | 132 | 489 | 297 | 522 | 342 | 338 | 371 | 347 | 421 | 410 | 501 | 475 |
| 2022 | 239 | 544 | 491 | 498 | 391 | 478 | 501 | 428 | 556 | 492 | 579 | 630 |
| 2023 | 457 | 509 | 602 | 637 | 730 | 1,132 | 1,044 | 794 | 703 | 1,008 | 642 | 1,148 |
| 2024 | 1,114 | 1,114 | 857 | 852 | 868 | 1,026 | ||||||
| - = No Data Reported; -- = Not Applicable; NA = Not Available; W = Withheld to avoid disclosure of individual company data. |
| Release Date: 8/30/2024 |
| Next Release Date: 9/30/2024 |