|
Download Data (XLS File) |
|
||||||||
|
||||||||
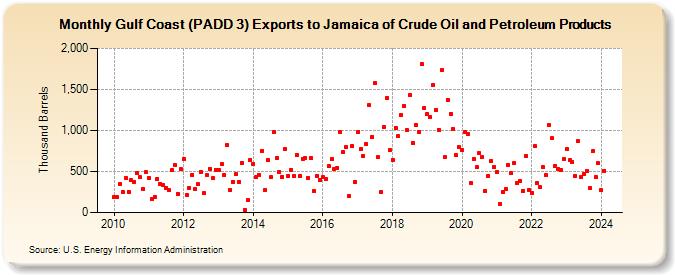
| Gulf Coast (PADD 3) Exports to Jamaica of Crude Oil and Petroleum Products (Thousand Barrels) | ||||||||
| Year | Jan | Feb | Mar | Apr | May | Jun | Jul | Aug | Sep | Oct | Nov | Dec |
|---|---|---|---|---|---|---|---|---|---|---|---|---|
| 2010 | 189 | 187 | 342 | 251 | 423 | 255 | 394 | 378 | 476 | 428 | 286 | 491 |
| 2011 | 417 | 160 | 193 | 409 | 352 | 334 | 295 | 269 | 515 | 575 | 232 | 526 |
| 2012 | 652 | 219 | 302 | 463 | 286 | 343 | 492 | 233 | 458 | 534 | 419 | 523 |
| 2013 | 519 | 587 | 458 | 818 | 275 | 378 | 465 | 376 | 604 | 35 | 148 | 638 |
| 2014 | 593 | 433 | 460 | 753 | 273 | 638 | 428 | 987 | 665 | 496 | 431 | 774 |
| 2015 | 447 | 523 | 451 | 703 | 444 | 656 | 661 | 421 | 663 | 262 | 446 | 400 |
| 2016 | 431 | 411 | 564 | 652 | 535 | 543 | 980 | 734 | 797 | 201 | 807 | 373 |
| 2017 | 976 | 769 | 692 | 838 | 1,305 | 923 | 1,573 | 671 | 249 | 1,042 | 1,398 | 761 |
| 2018 | 645 | 1,032 | 929 | 1,190 | 1,297 | 1,001 | 1,430 | 849 | 1,064 | 984 | 1,810 | 1,275 |
| 2019 | 1,200 | 1,166 | 1,550 | 1,250 | 1,011 | 1,739 | 672 | 1,373 | 1,205 | 1,013 | 698 | 794 |
| 2020 | 764 | 976 | 960 | 362 | 655 | 549 | 721 | 677 | 265 | 448 | 625 | 552 |
| 2021 | 490 | 100 | 251 | 286 | 582 | 476 | 605 | 362 | 379 | 263 | 690 | 277 |
| 2022 | 237 | 810 | 359 | 308 | 551 | 457 | 1,061 | 904 | 564 | 536 | 516 | 647 |
| 2023 | 771 | 635 | 616 | 451 | 867 | 431 | 467 | 504 | 297 | 745 | 434 | 600 |
| 2024 | 272 | |||||||||||
| - = No Data Reported; -- = Not Applicable; NA = Not Available; W = Withheld to avoid disclosure of individual company data. |
| Release Date: 3/29/2024 |
| Next Release Date: 4/30/2024 |