|
Download Data (XLS File) |
|
||||||||
|
||||||||
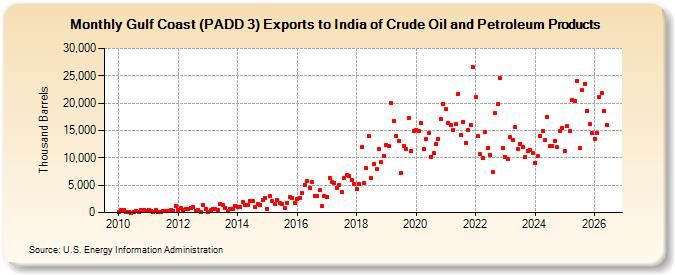
| Gulf Coast (PADD 3) Exports to India of Crude Oil and Petroleum Products (Thousand Barrels) | ||||||||
| Year | Jan | Feb | Mar | Apr | May | Jun | Jul | Aug | Sep | Oct | Nov | Dec |
|---|---|---|---|---|---|---|---|---|---|---|---|---|
| 2010 | 41 | 483 | 451 | 176 | 34 | 10 | 43 | 355 | 135 | 488 | 535 | 355 |
| 2011 | 455 | 297 | 40 | 430 | 33 | 19 | 280 | 308 | 337 | 508 | 287 | 1,201 |
| 2012 | 549 | 884 | 399 | 644 | 603 | 833 | 992 | 364 | 493 | 19 | 1,401 | 658 |
| 2013 | 58 | 400 | 696 | 632 | 427 | 1,559 | 1,424 | 834 | 198 | 658 | 570 | 1,223 |
| 2014 | 1,007 | 1,087 | 2,000 | 1,319 | 1,392 | 2,104 | 2,140 | 982 | 1,543 | 1,403 | 2,218 | 2,657 |
| 2015 | 660 | 3,024 | 2,037 | 1,635 | 2,324 | 1,790 | 1,571 | 878 | 1,816 | 2,757 | 2,665 | 1,815 |
| 2016 | 2,450 | 2,717 | 3,547 | 5,078 | 5,834 | 4,551 | 5,593 | 2,998 | 3,115 | 4,105 | 1,178 | 3,001 |
| 2017 | 2,873 | 6,355 | 5,583 | 5,412 | 4,552 | 5,046 | 3,755 | 6,355 | 6,865 | 6,594 | 6,003 | 5,217 |
| 2018 | 4,276 | 5,200 | 11,929 | 5,416 | 8,080 | 13,932 | 6,239 | 8,796 | 7,948 | 11,699 | 9,228 | 10,414 |
| 2019 | 12,379 | 12,222 | 20,052 | 16,817 | 14,042 | 13,136 | 7,163 | 12,244 | 11,611 | 17,366 | 11,192 | 14,891 |
| 2020 | 15,033 | 14,933 | 16,294 | 11,577 | 13,463 | 14,461 | 10,195 | 10,820 | 12,543 | 13,438 | 17,012 | 19,897 |
| 2021 | 18,836 | 16,426 | 15,930 | 15,172 | 16,099 | 21,740 | 14,237 | 16,607 | 12,733 | 15,035 | 15,965 | 26,623 |
| 2022 | 21,077 | 14,014 | 10,661 | 9,891 | 14,630 | 11,777 | 10,506 | 7,491 | 18,177 | 19,828 | 24,522 | 11,783 |
| 2023 | 8,227 | 10,165 | 14,229 | 14,681 | 14,148 | 11,726 | 12,447 | 11,471 | 10,436 | 10,925 | 11,094 | 10,851 |
| 2024 | 9,812 | |||||||||||
| - = No Data Reported; -- = Not Applicable; NA = Not Available; W = Withheld to avoid disclosure of individual company data. |
| Release Date: 3/29/2024 |
| Next Release Date: 4/30/2024 |