|
Download Data (XLS File) |
|
||||||||
|
||||||||
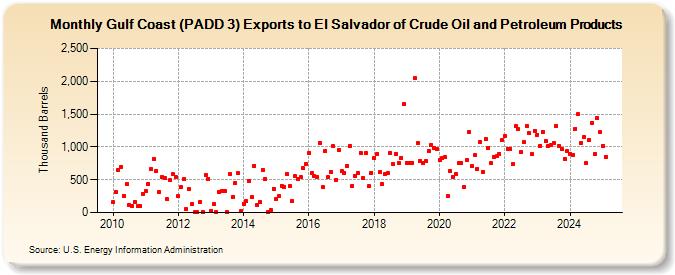
| Gulf Coast (PADD 3) Exports to El Salvador of Crude Oil and Petroleum Products (Thousand Barrels) | ||||||||
| Year | Jan | Feb | Mar | Apr | May | Jun | Jul | Aug | Sep | Oct | Nov | Dec |
|---|---|---|---|---|---|---|---|---|---|---|---|---|
| 2010 | 155 | 313 | 649 | 701 | 246 | 432 | 116 | 99 | 167 | 94 | 99 | 290 |
| 2011 | 321 | 437 | 662 | 821 | 636 | 316 | 538 | 530 | 200 | 491 | 583 | 545 |
| 2012 | 254 | 384 | 510 | 50 | 355 | 135 | 2 | 3 | 163 | 7 | 575 | 516 |
| 2013 | 24 | 125 | 6 | 315 | 329 | 324 | 5 | 590 | 241 | 449 | 595 | 18 |
| 2014 | 135 | 170 | 484 | 230 | 713 | 117 | 158 | 654 | 511 | 5 | 33 | 364 |
| 2015 | 206 | 250 | 411 | 391 | 589 | 400 | 178 | 550 | 512 | 537 | 673 | 743 |
| 2016 | 908 | 604 | 558 | 539 | 1,066 | 389 | 937 | 534 | 622 | 1,010 | 502 | 958 |
| 2017 | 626 | 609 | 706 | 1,018 | 410 | 564 | 596 | 912 | 519 | 904 | 397 | 607 |
| 2018 | 838 | 893 | 611 | 435 | 584 | 601 | 907 | 746 | 898 | 761 | 835 | 1,651 |
| 2019 | 759 | 748 | 759 | 2,048 | 1,054 | 791 | 750 | 781 | 942 | 1,029 | 978 | 969 |
| 2020 | 802 | 826 | 842 | 251 | 635 | 549 | 590 | 748 | 756 | 387 | 804 | 1,224 |
| 2021 | 702 | 873 | 667 | 1,072 | 623 | 1,126 | 990 | 751 | 843 | 861 | 897 | 1,099 |
| 2022 | 1,173 | 972 | 972 | 737 | 1,318 | 1,266 | 921 | 1,070 | 1,319 | 1,211 | 886 | 1,248 |
| 2023 | 1,167 | 723 | 1,209 | 990 | 1,013 | 1,007 | 997 | 1,325 | 962 | 1,017 | 823 | 936 |
| 2024 | 898 | |||||||||||
| - = No Data Reported; -- = Not Applicable; NA = Not Available; W = Withheld to avoid disclosure of individual company data. |
| Release Date: 3/29/2024 |
| Next Release Date: 4/30/2024 |