|
Download Data (XLS File) |
|
||||||||
|
||||||||
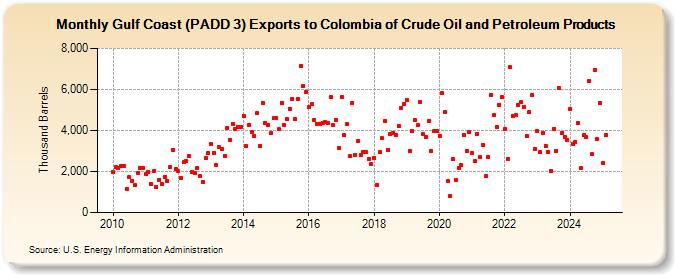
| Gulf Coast (PADD 3) Exports to Colombia of Crude Oil and Petroleum Products (Thousand Barrels) | ||||||||
| Year | Jan | Feb | Mar | Apr | May | Jun | Jul | Aug | Sep | Oct | Nov | Dec |
|---|---|---|---|---|---|---|---|---|---|---|---|---|
| 2010 | 1,982 | 2,201 | 2,172 | 2,280 | 2,267 | 1,126 | 1,710 | 1,556 | 1,329 | 1,952 | 2,162 | 2,192 |
| 2011 | 1,863 | 1,971 | 1,407 | 2,002 | 1,248 | 1,608 | 1,392 | 1,755 | 1,532 | 2,205 | 3,070 | 2,104 |
| 2012 | 2,008 | 1,707 | 2,449 | 2,491 | 2,748 | 1,992 | 1,914 | 2,190 | 1,766 | 1,471 | 2,636 | 2,899 |
| 2013 | 3,333 | 2,924 | 2,304 | 3,171 | 3,104 | 2,766 | 4,138 | 3,553 | 4,319 | 4,073 | 4,167 | 4,186 |
| 2014 | 4,722 | 3,224 | 4,275 | 3,907 | 3,748 | 4,834 | 3,239 | 5,359 | 4,357 | 4,243 | 3,862 | 4,593 |
| 2015 | 4,619 | 4,059 | 5,360 | 4,269 | 4,553 | 5,060 | 5,554 | 4,546 | 5,554 | 7,144 | 6,175 | 5,882 |
| 2016 | 5,126 | 5,268 | 4,512 | 4,336 | 4,330 | 4,387 | 4,396 | 4,356 | 5,607 | 4,251 | 4,530 | 3,166 |
| 2017 | 5,642 | 3,763 | 4,316 | 2,752 | 5,343 | 2,823 | 3,479 | 2,794 | 2,969 | 2,946 | 2,601 | 2,365 |
| 2018 | 2,672 | 1,337 | 2,928 | 3,613 | 4,466 | 3,039 | 3,847 | 3,883 | 3,761 | 4,204 | 5,087 | 5,281 |
| 2019 | 5,472 | 2,992 | 3,976 | 4,488 | 4,261 | 5,369 | 3,817 | 3,685 | 4,446 | 3,013 | 3,971 | 3,989 |
| 2020 | 3,744 | 5,808 | 4,889 | 1,515 | 825 | 2,615 | 1,588 | 2,155 | 2,315 | 3,798 | 3,012 | 3,910 |
| 2021 | 2,908 | 2,516 | 3,850 | 2,685 | 3,280 | 1,779 | 2,726 | 5,743 | 4,749 | 4,192 | 5,243 | 5,622 |
| 2022 | 4,066 | 2,618 | 7,092 | 4,723 | 4,753 | 5,232 | 5,368 | 5,144 | 3,752 | 4,887 | 5,740 | 3,102 |
| 2023 | 3,818 | 2,647 | 3,873 | 3,361 | 2,049 | 2,304 | 4,100 | 3,006 | 6,062 | 3,872 | 3,474 | 3,351 |
| 2024 | 5,042 | 3,327 | 3,417 | 4,368 | ||||||||
| - = No Data Reported; -- = Not Applicable; NA = Not Available; W = Withheld to avoid disclosure of individual company data. |
| Release Date: 6/28/2024 |
| Next Release Date: 7/31/2024 |