|
Download Data (XLS File) |
|
||||||||
|
||||||||
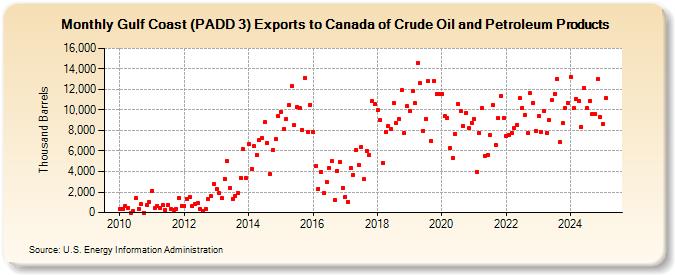
| Gulf Coast (PADD 3) Exports to Canada of Crude Oil and Petroleum Products (Thousand Barrels) | ||||||||
| Year | Jan | Feb | Mar | Apr | May | Jun | Jul | Aug | Sep | Oct | Nov | Dec |
|---|---|---|---|---|---|---|---|---|---|---|---|---|
| 2010 | 300 | 352 | 660 | 440 | 0 | 106 | 1,412 | 378 | 809 | 0 | 776 | 1,033 |
| 2011 | 2,145 | 424 | 661 | 446 | 714 | 239 | 758 | 373 | 272 | 363 | 1,392 | 688 |
| 2012 | 657 | 1,351 | 1,548 | 657 | 817 | 889 | 344 | 171 | 363 | 1,356 | 1,608 | 2,831 |
| 2013 | 2,316 | 1,881 | 1,374 | 3,282 | 4,978 | 2,429 | 1,363 | 1,611 | 1,925 | 3,386 | 6,153 | 3,342 |
| 2014 | 6,721 | 4,285 | 6,441 | 5,643 | 7,051 | 7,291 | 8,782 | 6,785 | 3,774 | 6,071 | 7,160 | 9,372 |
| 2015 | 9,826 | 8,115 | 9,165 | 10,443 | 12,300 | 8,491 | 10,287 | 10,151 | 8,059 | 13,154 | 7,844 | 10,514 |
| 2016 | 7,880 | 4,529 | 2,343 | 3,969 | 1,922 | 2,978 | 4,366 | 5,023 | 1,229 | 4,090 | 4,906 | 2,439 |
| 2017 | 1,560 | 1,069 | 4,345 | 3,687 | 6,106 | 4,646 | 6,365 | 3,237 | 6,012 | 5,633 | 10,866 | 10,541 |
| 2018 | 9,990 | 9,017 | 4,876 | 7,838 | 8,460 | 8,184 | 10,654 | 8,715 | 9,119 | 11,913 | 7,739 | 10,359 |
| 2019 | 9,924 | 11,858 | 10,636 | 14,612 | 12,600 | 7,975 | 9,149 | 12,846 | 6,993 | 12,828 | 11,562 | 11,573 |
| 2020 | 11,578 | 9,391 | 9,262 | 6,298 | 5,311 | 7,694 | 10,626 | 9,925 | 8,453 | 9,745 | 8,222 | 8,759 |
| 2021 | 9,137 | 3,983 | 7,771 | 10,150 | 5,547 | 5,632 | 7,567 | 10,468 | 6,549 | 9,185 | 11,368 | 9,237 |
| 2022 | 7,449 | 7,606 | 7,783 | 8,272 | 8,568 | 11,138 | 10,212 | 9,543 | 7,756 | 11,608 | 10,726 | 7,957 |
| 2023 | 7,962 | 7,900 | 9,921 | 7,686 | 8,602 | 10,852 | 11,532 | 13,025 | 6,851 | 8,693 | 10,168 | 10,726 |
| 2024 | 13,252 | |||||||||||
| - = No Data Reported; -- = Not Applicable; NA = Not Available; W = Withheld to avoid disclosure of individual company data. |
| Release Date: 3/29/2024 |
| Next Release Date: 4/30/2024 |