|
Download Data (XLS File) |
|
||||||||
|
||||||||
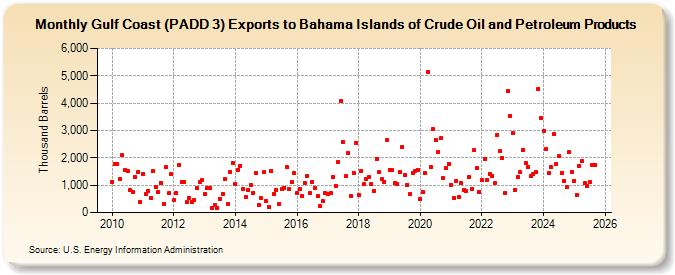
| Gulf Coast (PADD 3) Exports to Bahama Islands of Crude Oil and Petroleum Products (Thousand Barrels) | ||||||||
| Year | Jan | Feb | Mar | Apr | May | Jun | Jul | Aug | Sep | Oct | Nov | Dec |
|---|---|---|---|---|---|---|---|---|---|---|---|---|
| 2010 | 1,118 | 1,786 | 1,771 | 1,230 | 2,090 | 1,553 | 1,511 | 833 | 741 | 1,306 | 1,484 | 395 |
| 2011 | 1,422 | 661 | 804 | 543 | 1,527 | 948 | 758 | 1,094 | 327 | 1,659 | 705 | 1,398 |
| 2012 | 445 | 723 | 1,736 | 1,109 | 1,102 | 389 | 524 | 387 | 450 | 894 | 1,105 | 1,178 |
| 2013 | 672 | 907 | 915 | 174 | 282 | 180 | 506 | 691 | 1,233 | 297 | 1,494 | 1,827 |
| 2014 | 1,041 | 1,567 | 1,713 | 863 | 551 | 828 | 1,003 | 725 | 1,430 | 290 | 517 | 1,471 |
| 2015 | 438 | 215 | 1,520 | 696 | 812 | 309 | 854 | 912 | 1,647 | 859 | 1,116 | 1,431 |
| 2016 | 709 | 860 | 609 | 1,090 | 1,339 | 702 | 1,129 | 910 | 600 | 222 | 405 | 712 |
| 2017 | 673 | 720 | 1,313 | 977 | 1,833 | 4,077 | 2,580 | 1,320 | 2,169 | 592 | 1,463 | 2,541 |
| 2018 | 632 | 1,525 | 1,040 | 1,221 | 1,294 | 1,026 | 788 | 1,970 | 1,475 | 1,215 | 1,126 | 2,638 |
| 2019 | 1,573 | 1,544 | 1,067 | 1,042 | 1,476 | 2,394 | 1,378 | 1,025 | 665 | 1,452 | 1,528 | 1,566 |
| 2020 | 498 | 740 | 1,453 | 5,142 | 1,669 | 3,037 | 2,663 | 2,231 | 2,717 | 1,258 | 1,611 | 1,787 |
| 2021 | 1,009 | 547 | 1,171 | 565 | 1,082 | 830 | 785 | 1,294 | 876 | 2,272 | 1,612 | 745 |
| 2022 | 1,189 | 1,969 | 1,197 | 1,422 | 1,354 | 1,066 | 2,829 | 2,246 | 2,010 | 718 | 4,442 | 3,540 |
| 2023 | 2,844 | 1,002 | 1,368 | 2,043 | 2,239 | 1,759 | 1,639 | 1,394 | 1,351 | 1,476 | 4,525 | 3,452 |
| 2024 | 3,250 | |||||||||||
| - = No Data Reported; -- = Not Applicable; NA = Not Available; W = Withheld to avoid disclosure of individual company data. |
| Release Date: 3/29/2024 |
| Next Release Date: 4/30/2024 |