|
Download Data (XLS File) |
|
||||||||
|
||||||||
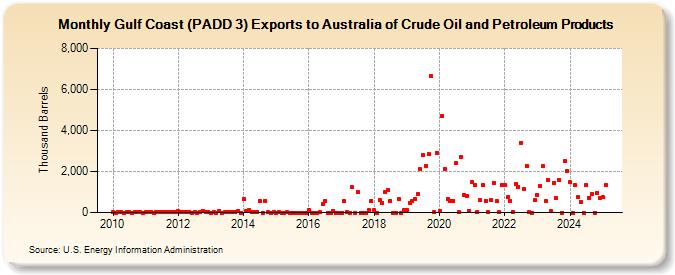
| Gulf Coast (PADD 3) Exports to Australia of Crude Oil and Petroleum Products (Thousand Barrels) | ||||||||
| Year | Jan | Feb | Mar | Apr | May | Jun | Jul | Aug | Sep | Oct | Nov | Dec |
|---|---|---|---|---|---|---|---|---|---|---|---|---|
| 2010 | 7 | 2 | 8 | 7 | 1 | 4 | 8 | 2 | 24 | 36 | 14 | 1 |
| 2011 | 11 | 15 | 28 | 1 | 26 | 14 | 9 | 30 | 34 | 25 | 23 | 15 |
| 2012 | 58 | 31 | 42 | 5 | 48 | 1 | 19 | 1 | 16 | 75 | 23 | 36 |
| 2013 | 0 | 21 | 1 | 97 | 1 | 3 | 8 | 25 | 7 | 7 | 89 | 1 |
| 2014 | 658 | 97 | 121 | 22 | 3 | 6 | 554 | 1 | 587 | 10 | 1 | 3 |
| 2015 | 1 | 8 | 1 | 1 | 10 | 1 | 2 | 2 | 2 | 1 | 2 | 2 |
| 2016 | 132 | 2 | 1 | 1 | 3 | 427 | 557 | 1 | 1 | 87 | 1 | 2 |
| 2017 | 1 | 551 | 3 | 1 | 1,234 | 2 | 999 | 1 | 1 | 1 | 104 | 587 |
| 2018 | 110 | 2 | 588 | 487 | 998 | 1,091 | 572 | 1 | 1 | 668 | 1 | 123 |
| 2019 | 134 | 457 | 551 | 651 | 912 | 2,109 | 2,794 | 2,270 | 2,853 | 6,641 | 16 | 2,922 |
| 2020 | 55 | 4,703 | 2,101 | 640 | 576 | 573 | 2,399 | 6 | 2,698 | 849 | 827 | 83 |
| 2021 | 1,481 | 1,323 | 5 | 616 | 1,339 | 585 | 5 | 607 | 1,464 | 573 | 4 | 1,338 |
| 2022 | 1,347 | 750 | 580 | 7 | 1,381 | 1,266 | 3,414 | 1,159 | 2,292 | 3 | 1 | 590 |
| 2023 | 875 | 1,284 | 2,262 | 551 | 2,173 | 62 | 1,463 | 726 | 1,606 | 111 | 2,827 | 2,036 |
| 2024 | 1,467 | |||||||||||
| - = No Data Reported; -- = Not Applicable; NA = Not Available; W = Withheld to avoid disclosure of individual company data. |
| Release Date: 3/29/2024 |
| Next Release Date: 4/30/2024 |