|
Download Data (XLS File) |
|
||||||||
|
||||||||
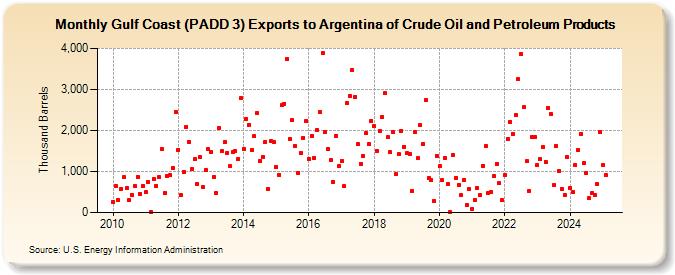
| Gulf Coast (PADD 3) Exports to Argentina of Crude Oil and Petroleum Products (Thousand Barrels) | ||||||||
| Year | Jan | Feb | Mar | Apr | May | Jun | Jul | Aug | Sep | Oct | Nov | Dec |
|---|---|---|---|---|---|---|---|---|---|---|---|---|
| 2010 | 264 | 641 | 302 | 583 | 861 | 597 | 296 | 433 | 643 | 873 | 462 | 656 |
| 2011 | 491 | 744 | 18 | 813 | 657 | 856 | 1,548 | 479 | 901 | 904 | 1,087 | 2,460 |
| 2012 | 1,532 | 425 | 996 | 2,095 | 1,721 | 1,051 | 1,298 | 701 | 1,347 | 624 | 1,033 | 1,538 |
| 2013 | 1,478 | 877 | 471 | 2,058 | 1,490 | 1,716 | 1,454 | 1,123 | 1,471 | 1,492 | 1,310 | 2,787 |
| 2014 | 1,552 | 2,279 | 2,142 | 1,520 | 1,864 | 2,425 | 1,263 | 1,360 | 1,722 | 579 | 1,738 | 1,715 |
| 2015 | 1,108 | 926 | 2,613 | 2,657 | 3,745 | 1,796 | 2,251 | 1,627 | 971 | 1,455 | 1,827 | 2,234 |
| 2016 | 1,305 | 1,873 | 1,333 | 2,018 | 2,447 | 3,879 | 1,972 | 1,539 | 1,274 | 747 | 1,876 | 1,131 |
| 2017 | 1,266 | 645 | 2,658 | 2,852 | 3,468 | 2,819 | 1,664 | 1,188 | 1,384 | 1,933 | 1,666 | 2,234 |
| 2018 | 2,104 | 1,498 | 1,982 | 2,325 | 2,906 | 1,832 | 1,465 | 1,951 | 932 | 1,415 | 1,994 | 1,607 |
| 2019 | 1,451 | 1,438 | 531 | 1,963 | 1,319 | 2,132 | 1,672 | 2,735 | 839 | 782 | 280 | 1,385 |
| 2020 | 1,128 | 785 | 1,332 | 688 | 16 | 1,411 | 854 | 681 | 420 | 795 | 181 | 562 |
| 2021 | 81 | 314 | 610 | 427 | 1,143 | 1,620 | 487 | 506 | 887 | 1,194 | 717 | 295 |
| 2022 | 921 | 1,801 | 2,216 | 1,917 | 2,381 | 3,243 | 3,867 | 2,565 | 1,245 | 528 | 1,851 | 1,840 |
| 2023 | 1,654 | 1,302 | 1,591 | 1,442 | 2,242 | 2,413 | 385 | 1,618 | 1,018 | 574 | 714 | 1,866 |
| 2024 | 598 | |||||||||||
| - = No Data Reported; -- = Not Applicable; NA = Not Available; W = Withheld to avoid disclosure of individual company data. |
| Release Date: 3/29/2024 |
| Next Release Date: 4/30/2024 |