|
Download Data (XLS File) |
|
||||||||
|
||||||||
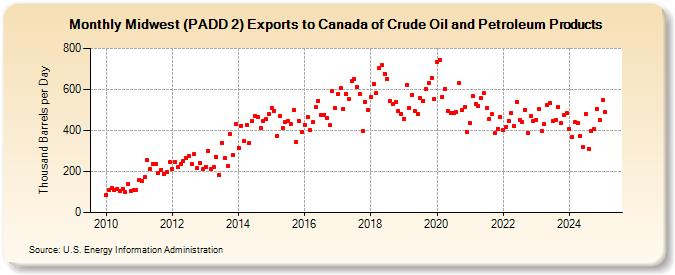
| Midwest (PADD 2) Exports to Canada of Crude Oil and Petroleum Products (Thousand Barrels per Day) | ||||||||
| Year | Jan | Feb | Mar | Apr | May | Jun | Jul | Aug | Sep | Oct | Nov | Dec |
|---|---|---|---|---|---|---|---|---|---|---|---|---|
| 2010 | 86 | 110 | 118 | 109 | 115 | 104 | 117 | 98 | 139 | 107 | 108 | 111 |
| 2011 | 161 | 153 | 172 | 256 | 213 | 237 | 239 | 193 | 209 | 189 | 196 | 244 |
| 2012 | 214 | 247 | 221 | 235 | 251 | 264 | 275 | 239 | 284 | 218 | 242 | 211 |
| 2013 | 224 | 301 | 214 | 220 | 269 | 181 | 341 | 266 | 229 | 385 | 280 | 431 |
| 2014 | 315 | 422 | 348 | 429 | 341 | 445 | 472 | 464 | 413 | 444 | 457 | 482 |
| 2015 | 511 | 496 | 375 | 471 | 413 | 440 | 444 | 432 | 502 | 345 | 447 | 395 |
| 2016 | 427 | 465 | 402 | 439 | 512 | 545 | 477 | 477 | 461 | 425 | 591 | 508 |
| 2017 | 576 | 606 | 507 | 578 | 554 | 639 | 651 | 614 | 579 | 397 | 541 | 499 |
| 2018 | 561 | 628 | 583 | 703 | 718 | 677 | 651 | 544 | 529 | 540 | 496 | 482 |
| 2019 | 456 | 623 | 510 | 575 | 495 | 481 | 557 | 546 | 601 | 630 | 657 | 551 |
| 2020 | 736 | 745 | 565 | 603 | 497 | 486 | 486 | 490 | 633 | 498 | 516 | 394 |
| 2021 | 436 | 566 | 527 | 520 | 556 | 581 | 510 | 455 | 478 | 388 | 409 | 465 |
| 2022 | 403 | 418 | 445 | 485 | 422 | 541 | 453 | 442 | 501 | 388 | 470 | 447 |
| 2023 | 452 | 503 | 397 | 430 | 524 | 534 | 447 | 453 | 514 | 434 | 476 | 483 |
| 2024 | 409 | 369 | 439 | 437 | 374 | 320 | ||||||
| - = No Data Reported; -- = Not Applicable; NA = Not Available; W = Withheld to avoid disclosure of individual company data. |
| Release Date: 8/30/2024 |
| Next Release Date: 9/30/2024 |