|
Download Data (XLS File) |
|
||||||||
|
||||||||
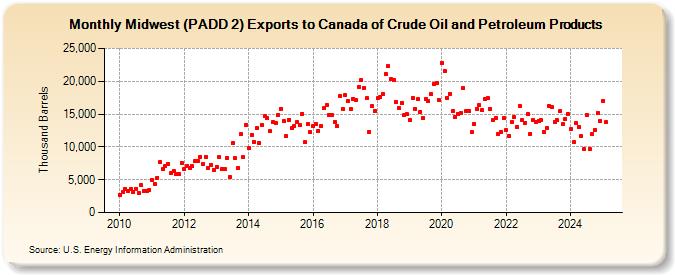
| Midwest (PADD 2) Exports to Canada of Crude Oil and Petroleum Products (Thousand Barrels) | ||||||||
| Year | Jan | Feb | Mar | Apr | May | Jun | Jul | Aug | Sep | Oct | Nov | Dec |
|---|---|---|---|---|---|---|---|---|---|---|---|---|
| 2010 | 2,674 | 3,071 | 3,661 | 3,271 | 3,579 | 3,114 | 3,633 | 3,043 | 4,155 | 3,306 | 3,233 | 3,436 |
| 2011 | 4,978 | 4,298 | 5,336 | 7,674 | 6,602 | 7,124 | 7,416 | 5,973 | 6,264 | 5,851 | 5,891 | 7,579 |
| 2012 | 6,630 | 7,159 | 6,839 | 7,056 | 7,794 | 7,917 | 8,532 | 7,407 | 8,521 | 6,772 | 7,255 | 6,551 |
| 2013 | 6,949 | 8,419 | 6,638 | 6,589 | 8,337 | 5,423 | 10,564 | 8,245 | 6,861 | 11,942 | 8,396 | 13,354 |
| 2014 | 9,772 | 11,829 | 10,774 | 12,872 | 10,568 | 13,358 | 14,637 | 14,399 | 12,378 | 13,759 | 13,712 | 14,927 |
| 2015 | 15,842 | 13,898 | 11,633 | 14,135 | 12,807 | 13,196 | 13,768 | 13,384 | 15,054 | 10,701 | 13,422 | 12,234 |
| 2016 | 13,246 | 13,488 | 12,477 | 13,165 | 15,872 | 16,359 | 14,802 | 14,791 | 13,824 | 13,169 | 17,727 | 15,748 |
| 2017 | 17,861 | 16,963 | 15,721 | 17,333 | 17,163 | 19,165 | 20,166 | 19,037 | 17,381 | 12,318 | 16,217 | 15,484 |
| 2018 | 17,380 | 17,572 | 18,076 | 21,102 | 22,261 | 20,313 | 20,171 | 16,862 | 15,869 | 16,750 | 14,873 | 14,943 |
| 2019 | 14,144 | 17,455 | 15,810 | 17,249 | 15,357 | 14,426 | 17,275 | 16,938 | 18,044 | 19,519 | 19,702 | 17,088 |
| 2020 | 22,829 | 21,614 | 17,513 | 18,094 | 15,399 | 14,578 | 15,072 | 15,189 | 18,987 | 15,435 | 15,472 | 12,210 |
| 2021 | 13,523 | 15,844 | 16,327 | 15,600 | 17,236 | 17,420 | 15,821 | 14,114 | 14,328 | 12,016 | 12,268 | 14,419 |
| 2022 | 12,508 | 11,692 | 13,784 | 14,560 | 13,097 | 16,231 | 14,032 | 13,701 | 15,030 | 12,025 | 14,087 | 13,850 |
| 2023 | 13,740 | 13,687 | 12,221 | 12,856 | 12,532 | 12,762 | 11,799 | 11,222 | 13,026 | 11,096 | 14,265 | 14,820 |
| 2024 | 12,691 | |||||||||||
| - = No Data Reported; -- = Not Applicable; NA = Not Available; W = Withheld to avoid disclosure of individual company data. |
| Release Date: 3/29/2024 |
| Next Release Date: 4/30/2024 |