|
Download Data (XLS File) |
|
||||||||
|
||||||||
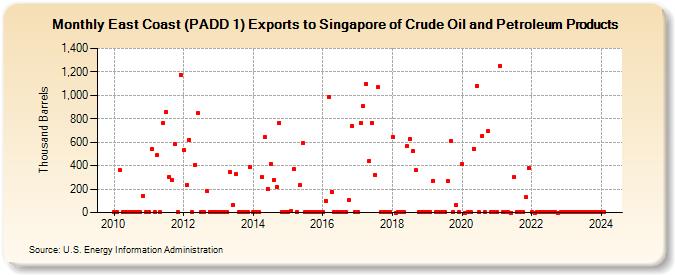
| East Coast (PADD 1) Exports to Singapore of Crude Oil and Petroleum Products (Thousand Barrels) | ||||||||
| Year | Jan | Feb | Mar | Apr | May | Jun | Jul | Aug | Sep | Oct | Nov | Dec |
|---|---|---|---|---|---|---|---|---|---|---|---|---|
| 2010 | 1 | 1 | 360 | 1 | 1 | 1 | 2 | 2 | 1 | 2 | 143 | 1 |
| 2011 | 1 | 543 | 1 | 489 | 1 | 764 | 859 | 305 | 278 | 581 | 2 | 1,177 |
| 2012 | 533 | 233 | 622 | 2 | 408 | 846 | 2 | 3 | 180 | 2 | 3 | 3 |
| 2013 | 1 | 1 | 7 | 3 | 344 | 61 | 326 | 1 | 1 | 3 | 2 | 387 |
| 2014 | 4 | 3 | 1 | 302 | 646 | 202 | 416 | 278 | 220 | 764 | 1 | 1 |
| 2015 | 1 | 12 | 370 | 3 | 231 | 591 | 2 | 4 | 4 | 1 | 2 | 1 |
| 2016 | 1 | 101 | 985 | 178 | 1 | 2 | 1 | 1 | 1 | 108 | 742 | 1 |
| 2017 | 1 | 767 | 906 | 1,098 | 443 | 766 | 324 | 1,068 | 2 | 1 | 1 | 2 |
| 2018 | 645 | 0 | 1 | 3 | 2 | 564 | 629 | 522 | 362 | 2 | 1 | 1 |
| 2019 | 1 | 1 | 273 | 1 | 1 | 1 | 1 | 267 | 613 | 3 | 65 | 1 |
| 2020 | 410 | 0 | 1 | 2 | 545 | 1,081 | 2 | 653 | 1 | 692 | 1 | 1 |
| 2021 | 1 | 1,251 | 2 | 1 | 1 | 0 | 303 | 1 | 1 | 1 | 129 | 377 |
| 2022 | 1 | 0 | 1 | 3 | 4 | 5 | 3 | 2 | 1 | 0 | 1 | 1 |
| 2023 | 3 | 1 | 2 | 5 | 2 | 2 | 1 | 2 | 1 | 1 | 3 | 2 |
| 2024 | 2 | |||||||||||
| - = No Data Reported; -- = Not Applicable; NA = Not Available; W = Withheld to avoid disclosure of individual company data. |
| Release Date: 3/29/2024 |
| Next Release Date: 4/30/2024 |