|
Download Data (XLS File) |
|
||||||||
|
||||||||
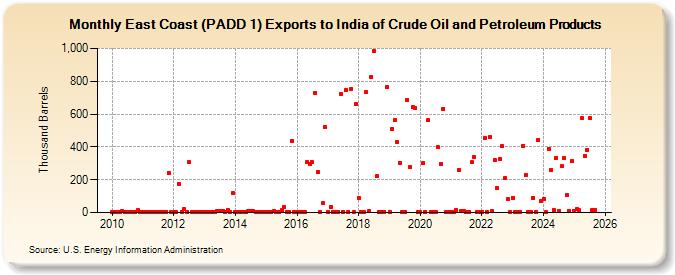
| East Coast (PADD 1) Exports to India of Crude Oil and Petroleum Products (Thousand Barrels) | ||||||||
| Year | Jan | Feb | Mar | Apr | May | Jun | Jul | Aug | Sep | Oct | Nov | Dec |
|---|---|---|---|---|---|---|---|---|---|---|---|---|
| 2010 | 3 | 3 | 4 | 5 | 10 | 6 | 6 | 3 | 2 | 2 | 13 | 2 |
| 2011 | 2 | 4 | 6 | 5 | 3 | 5 | 4 | 4 | 4 | 6 | 241 | 3 |
| 2012 | 3 | 3 | 176 | 6 | 21 | 5 | 305 | 6 | 2 | 2 | 2 | 5 |
| 2013 | 3 | 4 | 4 | 3 | 6 | 7 | 7 | 7 | 4 | 17 | 4 | 118 |
| 2014 | 4 | 3 | 3 | 4 | 6 | 7 | 10 | 7 | 4 | 6 | 1 | 4 |
| 2015 | 4 | 3 | 5 | 7 | 5 | 4 | 14 | 32 | 4 | 3 | 438 | 5 |
| 2016 | 2 | 4 | 3 | 5 | 306 | 293 | 307 | 730 | 247 | 4 | 56 | 520 |
| 2017 | 4 | 33 | 3 | 5 | 6 | 720 | 5 | 748 | 6 | 754 | 3 | 661 |
| 2018 | 91 | 6 | 6 | 732 | 7 | 826 | 985 | 221 | 5 | 5 | 5 | 764 |
| 2019 | 4 | 511 | 563 | 427 | 304 | 3 | 4 | 687 | 277 | 642 | 636 | 2 |
| 2020 | 2 | 301 | 6 | 562 | 3 | 3 | 2 | 397 | 295 | 633 | 3 | 2 |
| 2021 | 3 | 5 | 18 | 259 | 8 | 7 | 4 | 4 | 305 | 338 | 6 | 3 |
| 2022 | 2 | 457 | 3 | 460 | 8 | 318 | 147 | 327 | 403 | 210 | 80 | 2 |
| 2023 | 2 | 3 | 3 | 3 | 408 | 229 | 3 | 3 | 83 | 5 | 501 | 73 |
| 2024 | 75 | |||||||||||
| - = No Data Reported; -- = Not Applicable; NA = Not Available; W = Withheld to avoid disclosure of individual company data. |
| Release Date: 3/29/2024 |
| Next Release Date: 4/30/2024 |