|
Download Data (XLS File) |
|
||||||||
|
||||||||
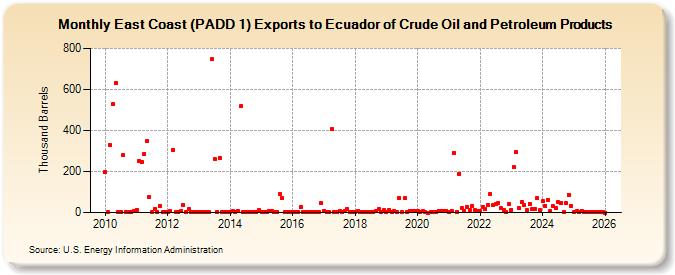
| East Coast (PADD 1) Exports to Ecuador of Crude Oil and Petroleum Products (Thousand Barrels) | ||||||||
| Year | Jan | Feb | Mar | Apr | May | Jun | Jul | Aug | Sep | Oct | Nov | Dec |
|---|---|---|---|---|---|---|---|---|---|---|---|---|
| 2010 | 197 | 1 | 329 | 527 | 632 | 1 | 1 | 280 | 2 | 4 | 2 | 6 |
| 2011 | 14 | 253 | 245 | 287 | 348 | 77 | 2 | 18 | 4 | 33 | 1 | 2 |
| 2012 | 3 | 6 | 304 | 2 | 3 | 6 | 37 | 3 | 17 | 4 | 3 | 2 |
| 2013 | 4 | 4 | 5 | 3 | 2 | 747 | 262 | 4 | 267 | 5 | 1 | 2 |
| 2014 | 4 | 6 | 4 | 9 | 517 | 3 | 2 | 4 | 1 | 4 | 3 | 11 |
| 2015 | 2 | 4 | 5 | 6 | 7 | 4 | 3 | 91 | 70 | 1 | 5 | 3 |
| 2016 | 5 | 2 | 5 | 26 | 3 | 4 | 3 | 2 | 5 | 2 | 5 | 45 |
| 2017 | 10 | 2 | 2 | 408 | 3 | 5 | 7 | 2 | 8 | 18 | 4 | 3 |
| 2018 | 3 | 7 | 2 | 3 | 4 | 2 | 3 | 1 | 8 | 16 | 5 | 12 |
| 2019 | 4 | 14 | 3 | 6 | 4 | 70 | 2 | 69 | 3 | 9 | 7 | 7 |
| 2020 | 8 | 2 | 8 | 1 | 0 | 1 | 3 | 2 | 8 | 6 | 8 | 8 |
| 2021 | 3 | 8 | 292 | 3 | 190 | 20 | 8 | 27 | 13 | 31 | 12 | 8 |
| 2022 | 7 | 27 | 15 | 37 | 89 | 38 | 42 | 45 | 20 | 11 | 1 | 41 |
| 2023 | 14 | 222 | 295 | 20 | 51 | 35 | 11 | 42 | 16 | 17 | 71 | 11 |
| 2024 | 54 | 31 | 63 | 7 | 34 | 21 | ||||||
| - = No Data Reported; -- = Not Applicable; NA = Not Available; W = Withheld to avoid disclosure of individual company data. |
| Release Date: 8/30/2024 |
| Next Release Date: 9/30/2024 |