|
Download Data (XLS File) |
|
||||||||
|
||||||||
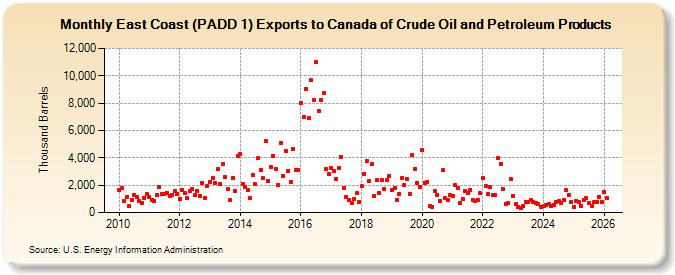
| East Coast (PADD 1) Exports to Canada of Crude Oil and Petroleum Products (Thousand Barrels) | ||||||||
| Year | Jan | Feb | Mar | Apr | May | Jun | Jul | Aug | Sep | Oct | Nov | Dec |
|---|---|---|---|---|---|---|---|---|---|---|---|---|
| 2010 | 1,646 | 1,765 | 836 | 1,161 | 509 | 919 | 1,309 | 1,123 | 840 | 670 | 1,086 | 1,328 |
| 2011 | 1,104 | 948 | 834 | 1,303 | 1,844 | 1,366 | 1,324 | 1,452 | 1,227 | 1,269 | 1,547 | 1,342 |
| 2012 | 1,025 | 1,658 | 1,410 | 1,049 | 1,567 | 1,719 | 1,259 | 1,611 | 1,229 | 2,182 | 1,047 | 1,911 |
| 2013 | 2,247 | 2,496 | 2,152 | 3,148 | 2,076 | 3,545 | 2,630 | 1,695 | 882 | 2,552 | 1,553 | 4,099 |
| 2014 | 4,265 | 2,122 | 1,846 | 1,653 | 1,076 | 2,721 | 2,082 | 3,955 | 3,113 | 2,491 | 5,215 | 2,271 |
| 2015 | 3,332 | 4,164 | 3,204 | 2,039 | 5,106 | 2,708 | 4,481 | 3,074 | 2,248 | 4,624 | 3,106 | 3,109 |
| 2016 | 8,024 | 6,964 | 9,063 | 6,883 | 9,661 | 8,237 | 10,972 | 7,449 | 8,223 | 8,756 | 3,167 | 2,805 |
| 2017 | 3,290 | 3,035 | 2,471 | 3,279 | 4,066 | 1,831 | 1,167 | 921 | 708 | 986 | 1,414 | 756 |
| 2018 | 1,909 | 2,848 | 3,744 | 2,284 | 3,525 | 1,216 | 2,382 | 1,402 | 2,374 | 1,730 | 2,415 | 2,680 |
| 2019 | 1,643 | 1,812 | 948 | 1,370 | 2,511 | 2,031 | 2,462 | 1,380 | 4,190 | 3,192 | 2,178 | 1,873 |
| 2020 | 4,574 | 2,195 | 2,243 | 516 | 421 | 1,544 | 1,313 | 861 | 3,120 | 1,079 | 948 | 1,316 |
| 2021 | 1,235 | 2,042 | 1,813 | 679 | 975 | 1,602 | 1,424 | 1,653 | 898 | 876 | 951 | 1,401 |
| 2022 | 2,496 | 1,935 | 1,328 | 1,860 | 1,249 | 1,318 | 3,970 | 3,582 | 1,702 | 608 | 664 | 2,486 |
| 2023 | 2,622 | 616 | 479 | 375 | 494 | 803 | 733 | 951 | 805 | 674 | 637 | 437 |
| 2024 | 440 | |||||||||||
| - = No Data Reported; -- = Not Applicable; NA = Not Available; W = Withheld to avoid disclosure of individual company data. |
| Release Date: 3/29/2024 |
| Next Release Date: 4/30/2024 |