|
Download Data (XLS File) |
|
||||||||
|
||||||||
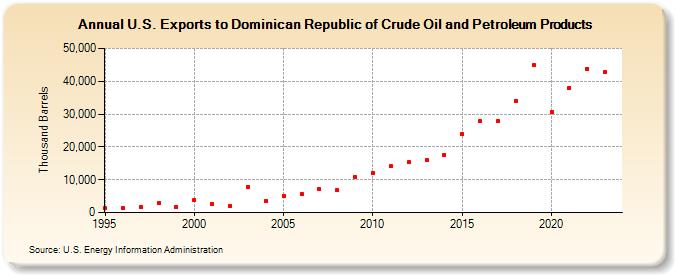
| U.S. Exports to Dominican Republic of Crude Oil and Petroleum Products (Thousand Barrels) | ||||||||
| Decade | Year-0 | Year-1 | Year-2 | Year-3 | Year-4 | Year-5 | Year-6 | Year-7 | Year-8 | Year-9 |
|---|---|---|---|---|---|---|---|---|---|---|
| 1990's | 1,373 | 1,354 | 1,845 | 2,850 | 1,690 | |||||
| 2000's | 3,963 | 2,672 | 2,110 | 7,887 | 3,588 | 5,100 | 5,785 | 7,063 | 6,719 | 10,795 |
| 2010's | 12,142 | 14,103 | 15,297 | 15,989 | 17,615 | 23,951 | 28,034 | 27,792 | 33,983 | 44,842 |
| 2020's | 30,679 | 38,042 | 43,800 | 42,820 |
| - = No Data Reported; -- = Not Applicable; NA = Not Available; W = Withheld to avoid disclosure of individual company data. |
| Release Date: 3/29/2024 |
| Next Release Date: 8/30/2024 |