|
Download Data (XLS File) |
|
||||||||
|
||||||||
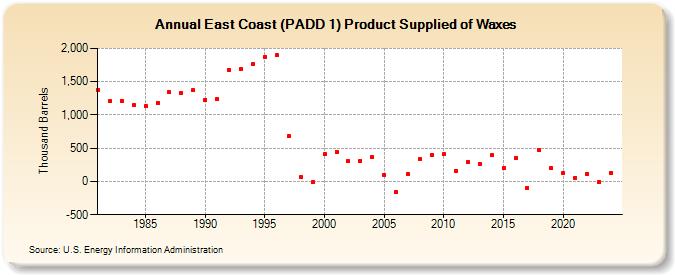
| East Coast (PADD 1) Product Supplied of Waxes (Thousand Barrels) | ||||||||
| Decade | Year-0 | Year-1 | Year-2 | Year-3 | Year-4 | Year-5 | Year-6 | Year-7 | Year-8 | Year-9 |
|---|---|---|---|---|---|---|---|---|---|---|
| 1980's | 1,382 | 1,205 | 1,212 | 1,142 | 1,132 | 1,186 | 1,339 | 1,330 | 1,369 | |
| 1990's | 1,230 | 1,235 | 1,677 | 1,688 | 1,765 | 1,874 | 1,894 | 683 | 63 | -13 |
| 2000's | 412 | 450 | 304 | 314 | 366 | 92 | -156 | 106 | 330 | 395 |
| 2010's | 408 | 161 | 295 | 266 | 393 | 195 | 354 | -95 | 466 | 202 |
| 2020's | 128 | 59 | 116 | -6 |
| - = No Data Reported; -- = Not Applicable; NA = Not Available; W = Withheld to avoid disclosure of individual company data. |
| Release Date: 3/29/2024 |
| Next Release Date: 8/30/2024 |