|
Download Data (XLS File) |
|
||||||||
|
||||||||
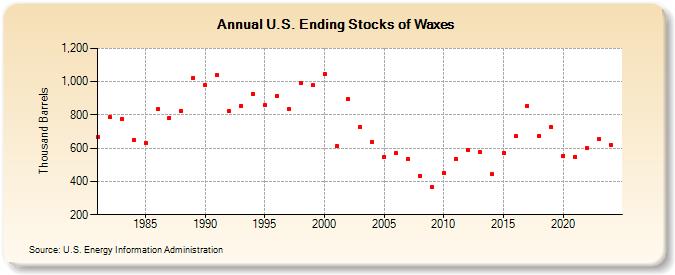
| U.S. Ending Stocks of Waxes (Thousand Barrels) | ||||||||
| Decade | Year-0 | Year-1 | Year-2 | Year-3 | Year-4 | Year-5 | Year-6 | Year-7 | Year-8 | Year-9 |
|---|---|---|---|---|---|---|---|---|---|---|
| 1980's | 670 | 786 | 777 | 652 | 632 | 834 | 783 | 824 | 1,022 | |
| 1990's | 977 | 1,038 | 821 | 854 | 928 | 857 | 914 | 834 | 993 | 977 |
| 2000's | 1,047 | 612 | 896 | 727 | 640 | 549 | 570 | 534 | 435 | 364 |
| 2010's | 453 | 536 | 588 | 577 | 443 | 573 | 671 | 855 | 676 | 726 |
| 2020's | 555 | 549 | 601 | 656 |
| - = No Data Reported; -- = Not Applicable; NA = Not Available; W = Withheld to avoid disclosure of individual company data. |
| Release Date: 3/29/2024 |
| Next Release Date: 8/30/2024 |
Referring Pages: