|
Download Data (XLS File) |
|
||||||||
|
||||||||
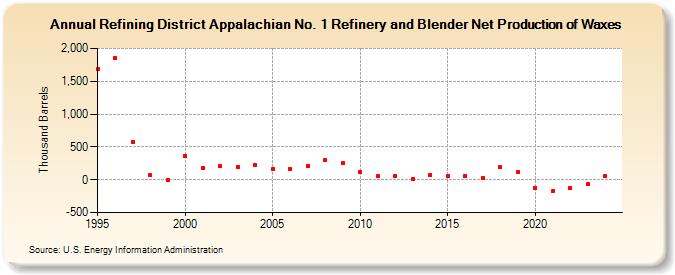
| Refining District Appalachian No. 1 Refinery and Blender Net Production of Waxes (Thousand Barrels) | ||||||||
| Decade | Year-0 | Year-1 | Year-2 | Year-3 | Year-4 | Year-5 | Year-6 | Year-7 | Year-8 | Year-9 |
|---|---|---|---|---|---|---|---|---|---|---|
| 1990's | 1,679 | 1,861 | 571 | 68 | -8 | |||||
| 2000's | 360 | 183 | 205 | 195 | 220 | 161 | 161 | 206 | 298 | 251 |
| 2010's | 123 | 53 | 62 | 4 | 70 | 64 | 56 | 27 | 199 | 115 |
| 2020's | -122 | -179 | -124 | -72 |
| - = No Data Reported; -- = Not Applicable; NA = Not Available; W = Withheld to avoid disclosure of individual company data. |
| Release Date: 4/30/2024 |
| Next Release Date: 8/30/2024 |