|
Download Data (XLS File) |
|
||||||||
|
||||||||
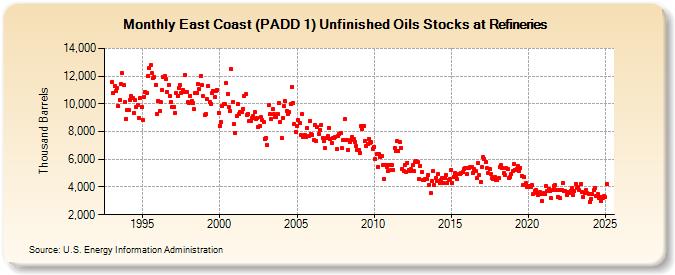
| East Coast (PADD 1) Unfinished Oils Stocks at Refineries (Thousand Barrels) | ||||||||
| Year | Jan | Feb | Mar | Apr | May | Jun | Jul | Aug | Sep | Oct | Nov | Dec |
|---|---|---|---|---|---|---|---|---|---|---|---|---|
| 1993 | 11,581 | 10,816 | 11,272 | 10,902 | 11,146 | 9,853 | 10,311 | 11,430 | 12,196 | 11,343 | 10,139 | 8,937 |
| 1994 | 9,532 | 9,550 | 10,271 | 10,555 | 10,388 | 9,342 | 10,254 | 9,780 | 9,886 | 8,993 | 10,441 | 9,744 |
| 1995 | 8,844 | 10,516 | 10,869 | 10,747 | 11,992 | 12,609 | 12,772 | 12,204 | 11,835 | 11,932 | 11,385 | 9,275 |
| 1996 | 10,229 | 9,450 | 10,110 | 10,981 | 11,935 | 11,972 | 11,770 | 10,869 | 11,384 | 10,580 | 10,135 | 9,765 |
| 1997 | 9,791 | 9,364 | 10,757 | 10,558 | 11,130 | 11,348 | 10,788 | 11,002 | 10,886 | 12,070 | 10,880 | 10,106 |
| 1998 | 10,058 | 10,568 | 10,170 | 10,030 | 9,610 | 10,793 | 10,812 | 11,419 | 11,066 | 11,996 | 11,327 | 10,546 |
| 1999 | 9,194 | 9,263 | 10,326 | 11,292 | 10,126 | 9,976 | 10,809 | 10,943 | 10,474 | 10,932 | 10,985 | 9,360 |
| 2000 | 8,409 | 8,655 | 9,862 | 9,996 | 9,971 | 11,473 | 10,744 | 9,764 | 9,450 | 12,479 | 10,143 | 8,518 |
| 2001 | 7,915 | 9,109 | 9,995 | 9,274 | 9,395 | 9,404 | 9,658 | 10,600 | 10,681 | 9,184 | 9,290 | 8,762 |
| 2002 | 8,733 | 8,953 | 9,118 | 9,381 | 8,904 | 8,972 | 8,326 | 8,384 | 9,025 | 8,812 | 8,691 | 7,485 |
| 2003 | 7,556 | 7,021 | 9,893 | 9,238 | 8,891 | 9,598 | 9,296 | 9,081 | 9,017 | 9,250 | 10,045 | 8,707 |
| 2004 | 7,562 | 9,011 | 9,820 | 10,172 | 9,461 | 9,259 | 9,440 | 9,985 | 11,250 | 10,081 | 8,552 | 7,982 |
| 2005 | 8,415 | 8,817 | 8,593 | 7,756 | 9,237 | 7,631 | 7,760 | 7,610 | 8,278 | 7,645 | 8,795 | 7,854 |
| 2006 | 7,784 | 7,404 | 8,497 | 7,321 | 8,341 | 7,828 | 8,132 | 8,501 | 7,556 | 7,352 | 6,799 | 7,561 |
| 2007 | 7,668 | 8,264 | 7,430 | 7,194 | 7,541 | 7,543 | 7,588 | 6,710 | 7,695 | 7,800 | 7,885 | 6,786 |
| 2008 | 7,374 | 8,885 | 7,391 | 7,368 | 6,672 | 7,230 | 7,404 | 7,636 | 7,451 | 7,226 | 6,961 | 6,702 |
| 2009 | 6,664 | 6,469 | 8,386 | 8,168 | 8,431 | 7,347 | 6,950 | 7,098 | 7,455 | 7,210 | 7,226 | 6,774 |
| 2010 | 6,910 | 6,011 | 6,347 | 5,471 | 6,355 | 6,159 | 6,245 | 5,622 | 4,565 | 5,614 | 5,449 | 5,184 |
| 2011 | 5,562 | 5,203 | 5,613 | 5,262 | 6,797 | 6,570 | 7,305 | 6,597 | 7,233 | 6,828 | 5,329 | 5,131 |
| 2012 | 5,594 | 5,105 | 5,762 | 5,229 | 5,157 | 5,279 | 5,581 | 5,147 | 5,808 | 5,862 | 5,809 | 4,572 |
| 2013 | 5,528 | 5,074 | 4,513 | 4,496 | 4,565 | 4,600 | 4,878 | 4,177 | 3,531 | 4,417 | 5,123 | 4,120 |
| 2014 | 4,646 | 4,434 | 4,966 | 4,300 | 4,537 | 4,627 | 4,289 | 4,645 | 4,874 | 4,277 | 4,510 | 4,552 |
| 2015 | 5,242 | 4,299 | 4,755 | 5,002 | 4,715 | 4,553 | 4,933 | 4,942 | 4,981 | 5,058 | 5,316 | 5,352 |
| 2016 | 4,905 | 5,404 | 5,387 | 5,422 | 5,416 | 5,018 | 5,291 | 5,138 | 4,628 | 5,713 | 4,864 | 4,384 |
| 2017 | 5,449 | 6,132 | 5,984 | 5,771 | 5,341 | 5,044 | 5,294 | 4,954 | 4,669 | 4,609 | 4,741 | 4,540 |
| 2018 | 4,516 | 4,617 | 5,424 | 5,571 | 5,401 | 4,991 | 4,871 | 5,345 | 5,290 | 4,640 | 4,707 | 4,944 |
| 2019 | 5,121 | 5,649 | 5,235 | 5,327 | 5,503 | 5,161 | 5,394 | 4,819 | 4,116 | 4,696 | 4,254 | 4,027 |
| 2020 | 4,018 | 4,080 | 3,967 | 4,132 | 3,489 | 3,723 | 3,789 | 3,544 | 3,410 | 3,636 | 3,460 | 3,005 |
| 2021 | 3,567 | 3,488 | 4,060 | 3,694 | 3,877 | 3,711 | 3,173 | 3,766 | 4,077 | 4,122 | 3,754 | 3,302 |
| 2022 | 3,751 | 3,180 | 3,768 | 4,274 | 3,689 | 3,725 | 3,444 | 3,619 | 3,531 | 3,740 | 3,935 | 3,433 |
| 2023 | 3,704 | 4,237 | 3,921 | 4,008 | 3,794 | 4,213 | 3,644 | 3,262 | 3,602 | 3,760 | 3,543 | 3,530 |
| 2024 | 2,923 | 3,150 | 3,480 | 3,759 | ||||||||
| - = No Data Reported; -- = Not Applicable; NA = Not Available; W = Withheld to avoid disclosure of individual company data. |
| Release Date: 6/28/2024 |
| Next Release Date: 7/31/2024 |