|
Download Data (XLS File) |
|
||||||||
|
||||||||
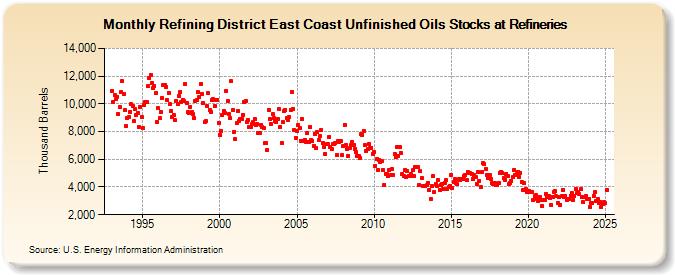
| Refining District East Coast Unfinished Oils Stocks at Refineries (Thousand Barrels) | ||||||||
| Year | Jan | Feb | Mar | Apr | May | Jun | Jul | Aug | Sep | Oct | Nov | Dec |
|---|---|---|---|---|---|---|---|---|---|---|---|---|
| 1993 | 10,920 | 10,145 | 10,629 | 10,324 | 10,521 | 9,260 | 9,749 | 10,847 | 11,618 | 10,684 | 9,538 | 8,410 |
| 1994 | 9,005 | 9,035 | 9,444 | 9,956 | 9,818 | 8,726 | 9,632 | 9,202 | 9,348 | 8,333 | 9,804 | 9,060 |
| 1995 | 8,241 | 9,907 | 10,108 | 10,100 | 11,273 | 11,893 | 12,069 | 11,492 | 11,127 | 11,281 | 10,779 | 8,688 |
| 1996 | 9,676 | 8,960 | 9,427 | 10,420 | 11,345 | 11,390 | 11,247 | 10,248 | 10,802 | 9,970 | 9,478 | 9,062 |
| 1997 | 9,197 | 8,815 | 10,187 | 10,012 | 10,563 | 10,828 | 10,157 | 10,309 | 10,185 | 11,422 | 10,071 | 9,384 |
| 1998 | 9,335 | 9,797 | 9,385 | 9,256 | 8,960 | 10,219 | 10,286 | 10,826 | 10,483 | 11,419 | 10,742 | 10,067 |
| 1999 | 8,685 | 8,736 | 9,822 | 10,757 | 9,539 | 9,416 | 10,244 | 10,329 | 9,838 | 10,279 | 10,279 | 8,639 |
| 2000 | 7,735 | 8,035 | 9,179 | 9,507 | 9,327 | 10,960 | 10,212 | 9,231 | 8,955 | 11,615 | 9,543 | 8,000 |
| 2001 | 7,449 | 8,620 | 9,493 | 8,788 | 8,895 | 8,919 | 9,213 | 10,125 | 10,211 | 8,694 | 8,869 | 8,333 |
| 2002 | 8,363 | 8,547 | 8,684 | 8,921 | 8,472 | 8,558 | 7,876 | 7,908 | 8,474 | 8,327 | 8,262 | 7,157 |
| 2003 | 7,154 | 6,662 | 9,573 | 8,891 | 8,554 | 9,256 | 8,948 | 8,740 | 8,709 | 8,922 | 9,605 | 8,332 |
| 2004 | 7,173 | 8,685 | 9,452 | 9,562 | 8,990 | 8,821 | 9,063 | 9,544 | 10,835 | 9,614 | 8,095 | 7,570 |
| 2005 | 8,059 | 8,453 | 8,224 | 7,344 | 8,901 | 7,309 | 7,399 | 7,268 | 7,908 | 7,281 | 8,355 | 7,385 |
| 2006 | 7,340 | 6,988 | 7,852 | 6,793 | 7,932 | 7,406 | 7,705 | 8,110 | 7,150 | 6,896 | 6,386 | 7,071 |
| 2007 | 7,089 | 7,642 | 6,909 | 6,732 | 7,107 | 7,116 | 7,159 | 6,316 | 7,324 | 7,247 | 7,350 | 6,290 |
| 2008 | 6,935 | 8,480 | 7,012 | 6,756 | 6,247 | 6,811 | 6,999 | 7,235 | 7,037 | 6,760 | 6,513 | 6,256 |
| 2009 | 6,263 | 6,065 | 7,792 | 7,774 | 8,055 | 7,000 | 6,606 | 6,721 | 7,088 | 6,842 | 6,845 | 6,413 |
| 2010 | 6,533 | 5,515 | 5,986 | 5,197 | 5,972 | 5,825 | 5,894 | 5,230 | 4,132 | 4,970 | 4,958 | 4,768 |
| 2011 | 5,196 | 4,831 | 5,281 | 4,853 | 6,406 | 6,180 | 6,921 | 6,252 | 6,881 | 6,473 | 4,935 | 4,772 |
| 2012 | 5,218 | 4,721 | 5,142 | 4,820 | 4,782 | 4,912 | 5,202 | 4,792 | 5,462 | 5,473 | 5,419 | 4,160 |
| 2013 | 5,127 | 4,646 | 4,088 | 4,074 | 4,082 | 4,122 | 4,323 | 3,799 | 3,150 | 4,040 | 4,763 | 3,668 |
| 2014 | 4,232 | 4,036 | 4,514 | 3,767 | 4,116 | 4,219 | 3,888 | 4,308 | 4,474 | 3,879 | 3,990 | 4,080 |
| 2015 | 4,850 | 3,911 | 4,348 | 4,551 | 4,257 | 4,189 | 4,567 | 4,521 | 4,561 | 4,567 | 4,793 | 4,866 |
| 2016 | 4,492 | 5,064 | 5,029 | 4,992 | 4,926 | 4,562 | 4,865 | 4,712 | 4,216 | 5,097 | 4,451 | 3,978 |
| 2017 | 5,064 | 5,719 | 5,623 | 5,302 | 4,848 | 4,637 | 4,895 | 4,549 | 4,272 | 4,219 | 4,322 | 4,122 |
| 2018 | 4,151 | 4,278 | 5,025 | 5,106 | 5,011 | 4,626 | 4,520 | 4,941 | 4,779 | 4,184 | 4,273 | 4,466 |
| 2019 | 4,722 | 5,238 | 4,864 | 4,949 | 5,102 | 4,744 | 5,011 | 4,379 | 3,758 | 4,256 | 3,876 | 3,615 |
| 2020 | 3,607 | 3,711 | 3,606 | 3,632 | 3,073 | 3,324 | 3,389 | 3,134 | 3,020 | 3,281 | 3,057 | 2,639 |
| 2021 | 3,075 | 3,053 | 3,513 | 3,294 | 3,382 | 3,239 | 2,713 | 3,303 | 3,635 | 3,683 | 3,326 | 2,851 |
| 2022 | 3,272 | 2,727 | 3,322 | 3,808 | 3,283 | 3,343 | 3,081 | 3,167 | 3,134 | 3,361 | 3,536 | 3,092 |
| 2023 | 3,346 | 3,875 | 3,595 | 3,623 | 3,472 | 3,850 | 3,306 | 2,889 | 3,245 | 3,367 | 3,147 | 3,168 |
| 2024 | 2,559 | 2,865 | 2,877 | 3,359 | ||||||||
| - = No Data Reported; -- = Not Applicable; NA = Not Available; W = Withheld to avoid disclosure of individual company data. |
| Release Date: 6/28/2024 |
| Next Release Date: 7/31/2024 |
Referring Pages: