|
Download Data (XLS File) |
|
||||||||
|
||||||||
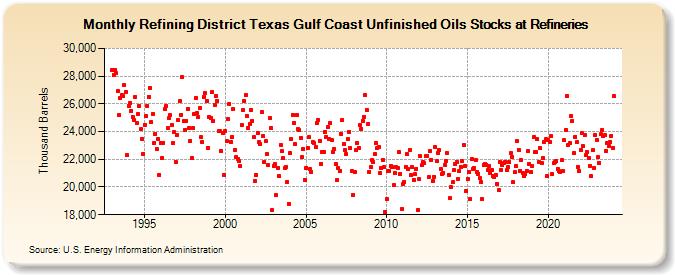
| Refining District Texas Gulf Coast Unfinished Oils Stocks at Refineries (Thousand Barrels) | ||||||||
| Year | Jan | Feb | Mar | Apr | May | Jun | Jul | Aug | Sep | Oct | Nov | Dec |
|---|---|---|---|---|---|---|---|---|---|---|---|---|
| 1993 | 28,461 | 28,115 | 28,468 | 28,191 | 26,924 | 25,163 | 26,450 | 26,633 | 26,574 | 27,375 | 26,873 | 22,282 |
| 1994 | 25,862 | 26,076 | 25,510 | 25,085 | 24,847 | 26,522 | 24,625 | 25,250 | 25,841 | 24,153 | 23,497 | 22,409 |
| 1995 | 24,507 | 25,119 | 25,842 | 26,522 | 27,178 | 24,679 | 25,272 | 23,204 | 23,793 | 22,746 | 23,470 | 20,883 |
| 1996 | 23,188 | 22,110 | 23,208 | 25,604 | 25,847 | 24,223 | 24,952 | 25,167 | 24,477 | 23,185 | 23,966 | 21,828 |
| 1997 | 23,750 | 24,839 | 26,195 | 25,228 | 27,917 | 24,763 | 24,139 | 24,758 | 25,648 | 24,241 | 23,312 | 22,092 |
| 1998 | 24,261 | 25,267 | 26,417 | 25,374 | 25,059 | 25,710 | 23,578 | 23,225 | 26,475 | 26,766 | 26,206 | 22,848 |
| 1999 | 25,052 | 24,985 | 26,827 | 24,758 | 25,894 | 26,558 | 26,232 | 24,007 | 24,019 | 22,592 | 23,884 | 20,848 |
| 2000 | 24,029 | 23,288 | 24,875 | 26,015 | 23,269 | 23,618 | 25,595 | 22,696 | 22,145 | 22,046 | 21,856 | 21,501 |
| 2001 | 24,472 | 25,526 | 26,228 | 26,646 | 25,147 | 24,278 | 24,534 | 25,565 | 24,773 | 23,598 | 20,443 | 20,900 |
| 2002 | 23,915 | 23,235 | 23,075 | 25,419 | 23,645 | 21,824 | 23,292 | 22,345 | 21,575 | 24,972 | 24,271 | 18,317 |
| 2003 | 21,544 | 21,633 | 19,406 | 21,403 | 20,759 | 23,038 | 22,564 | 22,089 | 21,344 | 21,477 | 20,390 | 18,792 |
| 2004 | 22,429 | 23,474 | 25,220 | 24,641 | 23,079 | 25,205 | 24,185 | 24,081 | 23,564 | 22,148 | 22,756 | 20,520 |
| 2005 | 21,372 | 22,789 | 23,603 | 21,268 | 21,113 | 23,232 | 23,152 | 22,869 | 24,611 | 24,846 | 23,344 | 21,695 |
| 2006 | 22,529 | 22,533 | 23,997 | 23,641 | 24,311 | 23,494 | 24,597 | 23,394 | 22,509 | 22,761 | 21,645 | 20,474 |
| 2007 | 21,352 | 21,178 | 23,850 | 24,845 | 23,073 | 22,642 | 22,368 | 23,437 | 24,003 | 22,815 | 21,131 | 19,448 |
| 2008 | 21,050 | 22,657 | 23,184 | 22,841 | 24,465 | 24,207 | 24,772 | 25,060 | 26,605 | 25,581 | 24,560 | 21,115 |
| 2009 | 21,430 | 21,927 | 21,795 | 22,348 | 23,163 | 22,819 | 22,911 | 21,008 | 21,340 | 21,980 | 21,423 | 18,170 |
| 2010 | 19,105 | 21,141 | 21,141 | 21,541 | 21,459 | 20,116 | 20,988 | 21,411 | 21,396 | 22,519 | 20,941 | 18,421 |
| 2011 | 20,187 | 20,366 | 21,476 | 22,358 | 21,271 | 22,675 | 20,863 | 21,423 | 20,521 | 20,914 | 21,324 | 18,309 |
| 2012 | 20,545 | 22,208 | 21,576 | 21,804 | 21,725 | 22,208 | 22,214 | 20,697 | 22,580 | 21,983 | 20,452 | 20,739 |
| 2013 | 22,873 | 21,866 | 22,479 | 22,634 | 21,308 | 20,950 | 21,045 | 21,620 | 21,880 | 22,437 | 20,879 | 19,173 |
| 2014 | 19,965 | 20,332 | 21,216 | 21,670 | 21,829 | 20,598 | 21,133 | 21,475 | 21,875 | 23,038 | 21,479 | 19,732 |
| 2015 | 20,572 | 21,080 | 19,108 | 21,999 | 21,273 | 21,393 | 21,960 | 21,098 | 20,970 | 20,621 | 20,337 | 19,117 |
| 2016 | 21,608 | 21,686 | 21,618 | 21,206 | 21,521 | 21,019 | 21,239 | 20,824 | 20,746 | 20,877 | 20,225 | 19,755 |
| 2017 | 21,836 | 21,225 | 21,571 | 21,743 | 21,839 | 21,204 | 21,422 | 21,817 | 22,427 | 22,174 | 20,330 | 21,063 |
| 2018 | 21,530 | 23,286 | 22,699 | 21,155 | 21,925 | 20,991 | 20,795 | 20,956 | 21,186 | 22,611 | 21,644 | 21,097 |
| 2019 | 21,491 | 23,617 | 22,502 | 22,523 | 23,444 | 21,808 | 22,814 | 21,751 | 22,081 | 23,229 | 23,429 | 20,773 |
| 2020 | 23,357 | 23,271 | 23,668 | 20,912 | 21,743 | 21,800 | 21,868 | 21,305 | 21,148 | 21,052 | 21,922 | 21,137 |
| 2021 | 23,364 | 24,096 | 26,587 | 23,054 | 23,172 | 25,139 | 24,797 | 22,436 | 23,641 | 23,213 | 21,457 | 21,151 |
| 2022 | 22,660 | 23,888 | 22,929 | 23,728 | 22,289 | 22,525 | 22,121 | 21,535 | 20,769 | 22,651 | 21,405 | 23,743 |
| 2023 | 23,413 | 22,156 | 21,756 | 23,802 | 24,102 | 23,644 | 23,720 | 22,603 | 23,146 | 22,970 | 23,248 | 23,715 |
| 2024 | 22,801 | |||||||||||
| - = No Data Reported; -- = Not Applicable; NA = Not Available; W = Withheld to avoid disclosure of individual company data. |
| Release Date: 3/29/2024 |
| Next Release Date: 4/30/2024 |
Referring Pages: